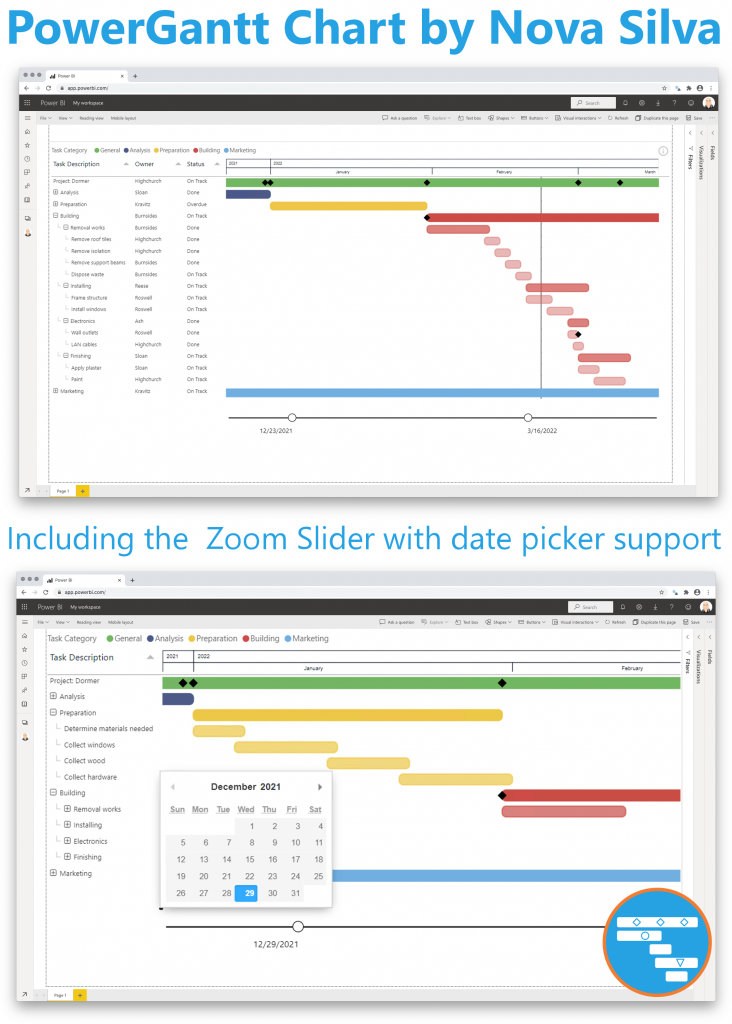
The Gantt chart is an excellent tool to visualize your program and project schedules and task dependencies. The horizontal bars show for each task/activity the period between the start and end date (or time). Icons can be used to represent milestones: important moments within your project timeline.
The PowerGantt Chart allows you to review both tasks/activities and milestones right in your Power BI reports. The PowerGantt Chart supports unlimited number of task/activities, hierarchy levels and number of milestones.
Key features of the PowerGantt Chart are:
- Insight into your program and project schedules: high level overview at first and dive into details using the collapse/expand buttons. Zoom into specific periods using the dynamic zoom slider
- Highly customisable: Add or remove columns, change colors of bars based on your own criteria, and change the date granularity
- No need to learn a new interface. Configuration is the same as a standard Power BI Bar Chart. And of course, theme colors and settings are supported
Don’t hesitate and try the PowerGannt Chart now on your own project/program data by downloading it from the AppSource.