
Description
There are numerous chart types to help us determine the main properties of a distribution (like central tendency, spread and form). The most popular ones are histograms, frequency polygons and box-and-whisker plots.
The challenge with these kind of charts is the fact they group your data in such a way it potentially could hide important features. Histograms and frequency polygons are extremely sensitive to the bin-size you select as user. The box-and-whisker plot is only applicable when you have a bell-shaped distribution. But the box-and-whisker plot becomes useless in case of a multimodal distribution.
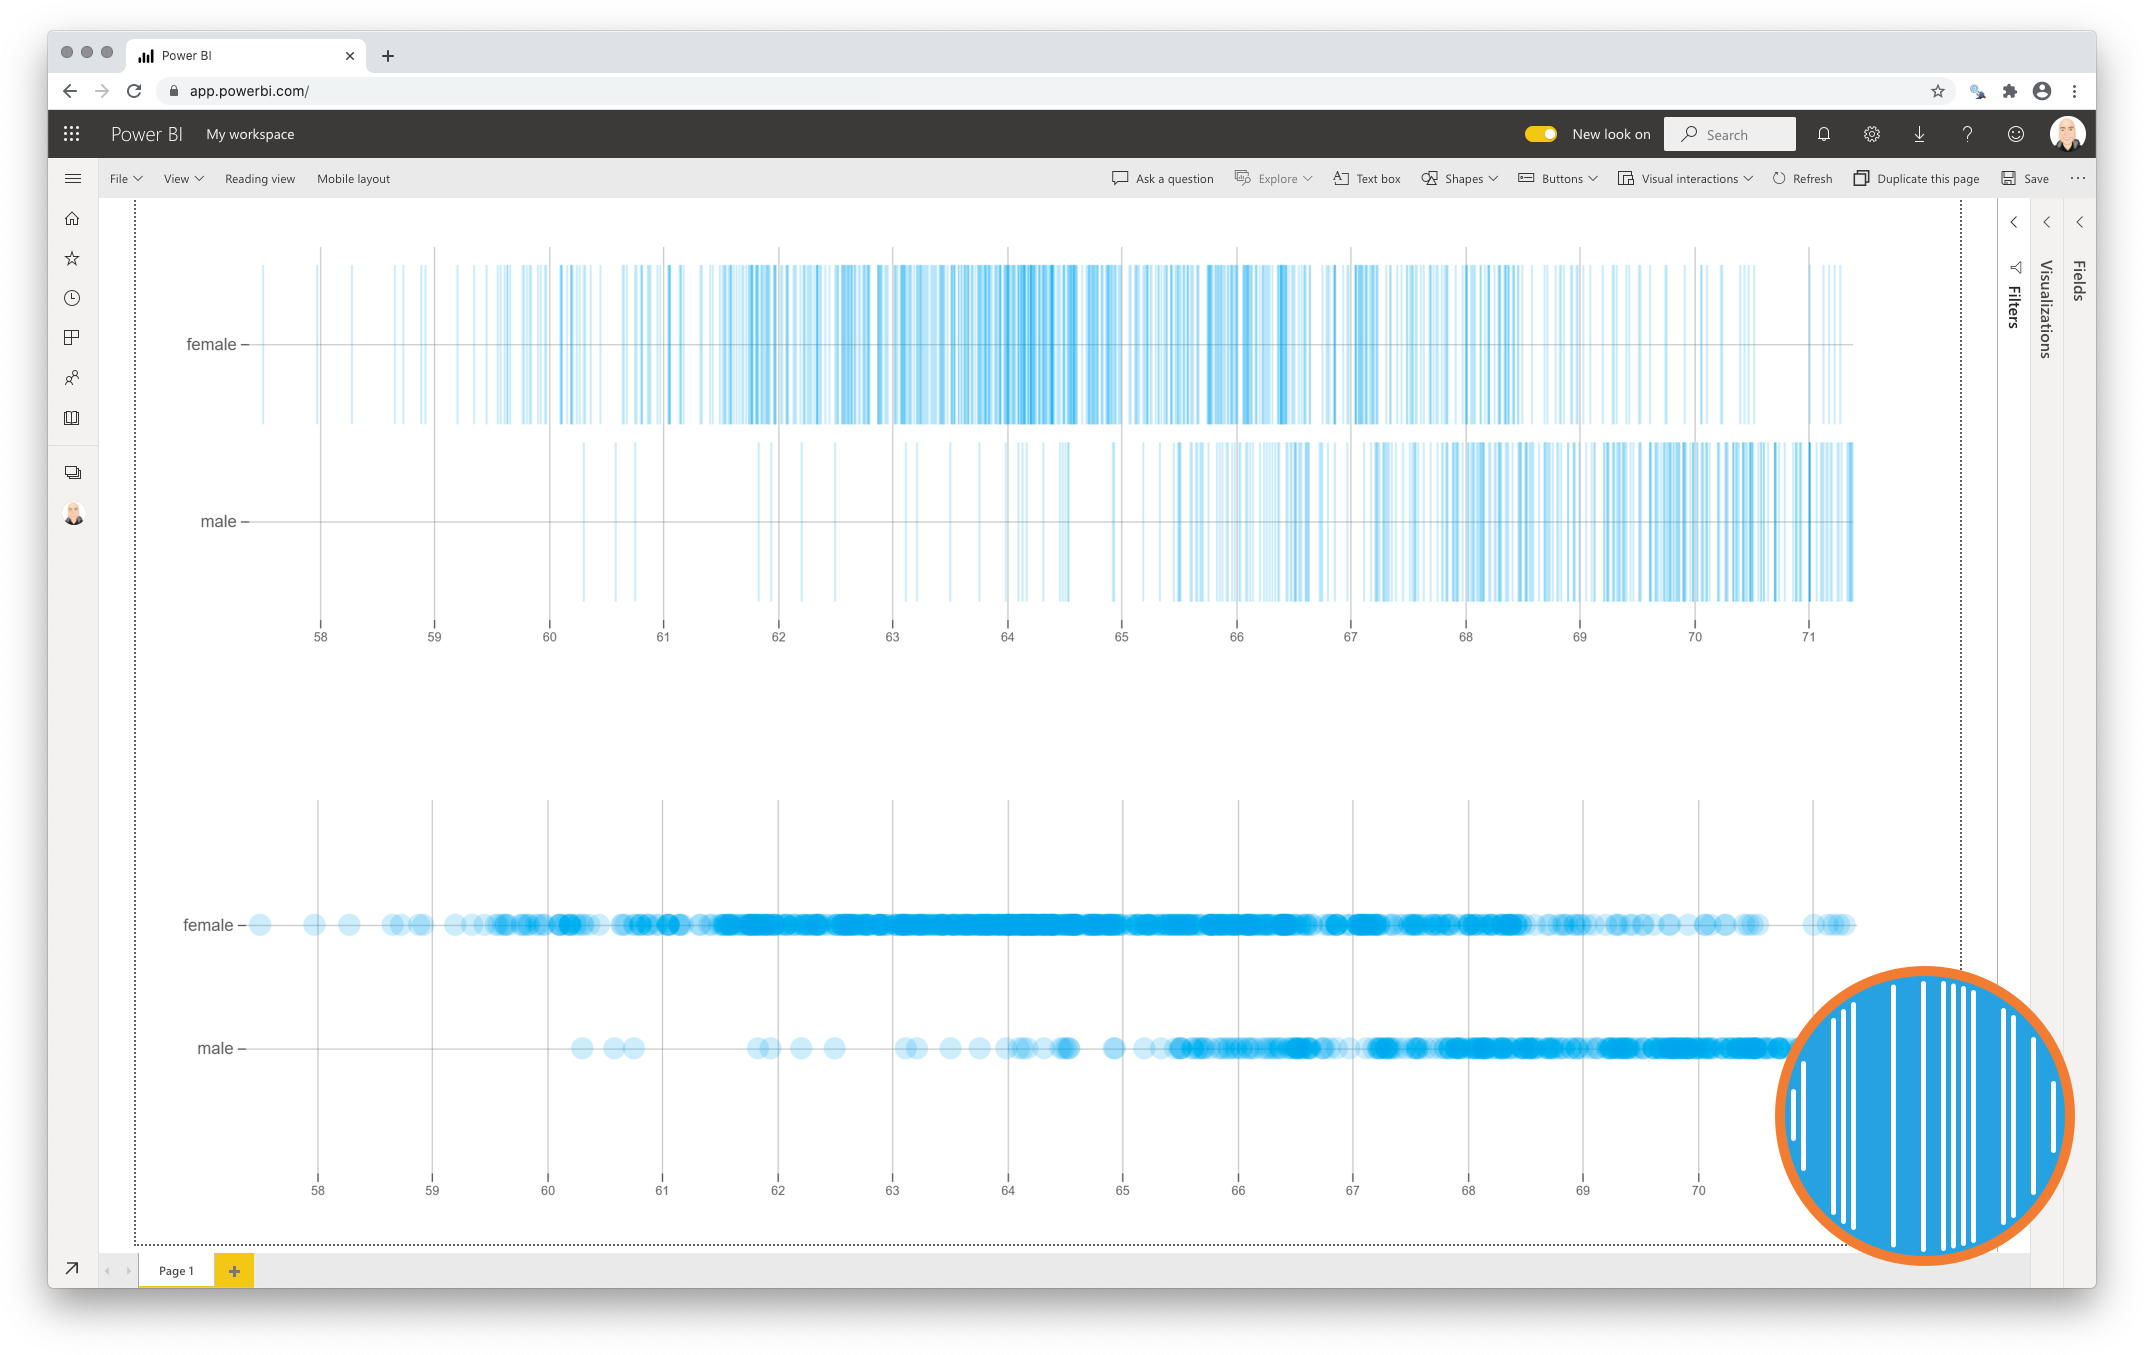
The Strip Plot for Power BI addresses these challenges by simply showing each point individually. No need to aggregate your data first. This will not only show you where the (concentration of) observations are, but also where gaps are between subsequent observations.
Key features of the Strip Plot for Power BI
-
Select an object for your data points. The Strip Plot can display a data point as a round dot, a triangle or a line;
-
Format the objects: The user can format each of the data point objects by selecting a fill and stroke color. The user can also set the size and opacity of each object;
-
Multiple series: The user can display one or multiple series (distributions) by adding a Category variable;
-
Change the Details: You determine the level of detail by changing the column placed in the Details field;
-
Large number of data points: The Strip Plot can display up to 30,000 data points;
-
Selection & Highlighting: Like in standard Power BI Charts you can make use of the Selection & Highlighting functions within the Strip Plot;
-
Context menu: Like in standard Power BI Charts you have access to the context menu to Include/Exclude data points;
-
Full tooltip support: Besides the default Tooltip behaviour (show the value of the element you hover) you can also add additional feeds to the tooltip.
Watch the video tutorial of the Strip Plot for Power BI HERE. Do you want to try the Shielded HTML Viewer yourself? Download it from the Microsoft AppSource for free.


Mark Wilcock –
Great for showing distribution of values in an intuitive way
The strip plot is great for showing the distribution or spread of values which is a common ask. It neatly addresses a need that is not possible with the standard palette of visuals. For example, it is ideal for showing say the distribution of inflation rates over countries or COVID infection rates in different regions of a country. The strip plot seems well engineered with all the capabilities of a standard visual (drill down, cross filtering etc) so we can use it instead of a standard visual