Support for Power BI Analytics pane
We have added support for analytics features to some of our visuals. You can now add dynamic reference lines to mark important trends or insights. The analytic lines are under the Analytics pane in the Visualizations area of Power BI Desktop or Service (Edit mode).
Dumbbell Bar Chart
Dumbbell Column Chart
Lipstick Bar Chart
Lipstick Column Chart
Lollipop Bar Chart
Lollipop Column Chart
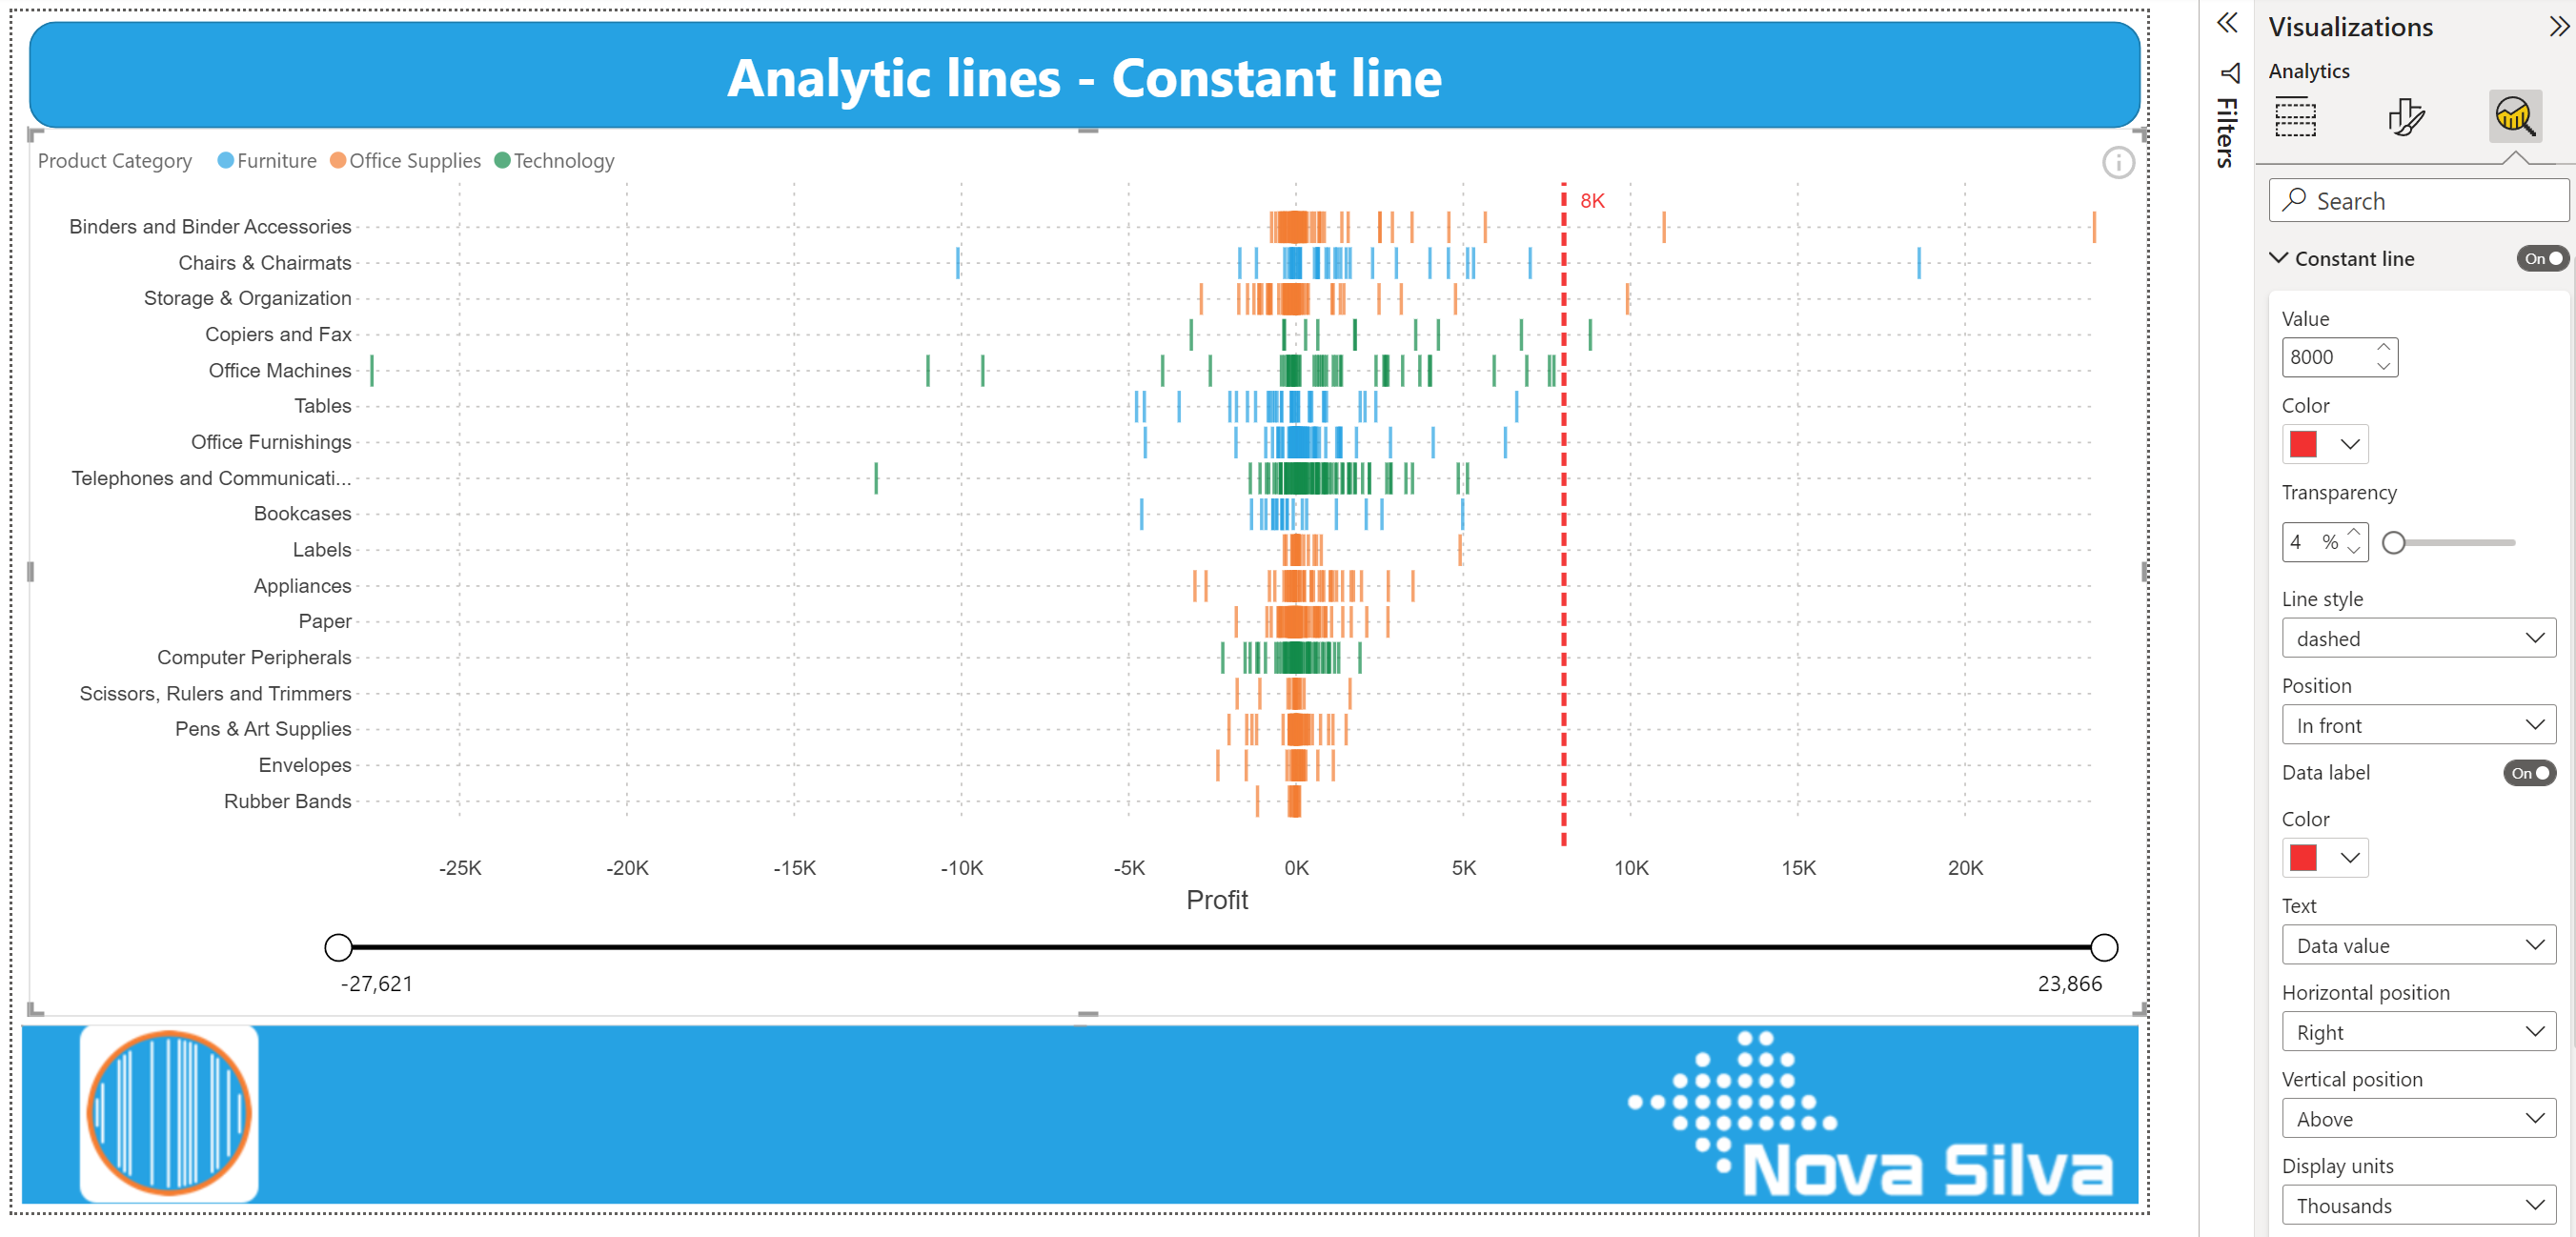
Strip Plot
Using the Analytics pane
You can highlight interesting trends and insights by creating dynamic reference lines with the Analytics pane. To add further analyses to your visual, select the visual and click the Analytics icon (magnifying glass).
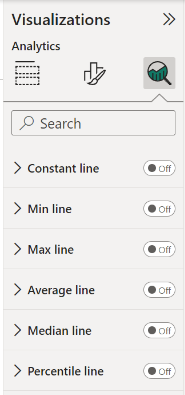
Available Analytic lines:
- Constant line: displays the value specified, helps to track metrics and desired goals
- Min line: displays the lowest value points on the axis
- Max line: displays the highest value points on the axis
- Average line: displays the data average
- Median line: displays the middle value
- Percentile line: displays the value (or score) below which x% of the observations may be found
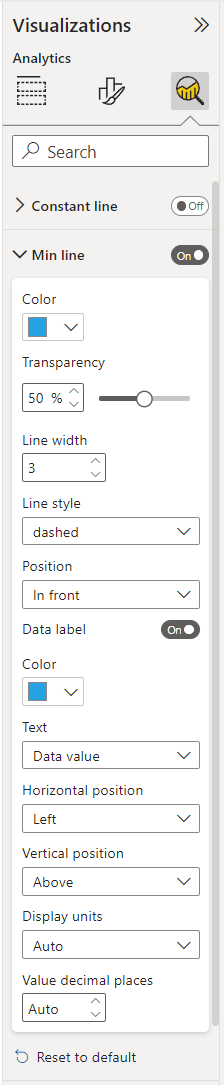
Formatting options for analytic lines are in line with the options you are familiar with from Power BI. Theme colors and settings are also supported.
Format your line by specifying the Color, Transparency percentage, Line width, style and position. For most lines you can specify the visual Measure to base your line upon, by selecting Primary or Secondary value from the drop-down menu.
If you want to have a data label, switch Data label On. You get additional formatting options for your data label, such as: Color, Text, Horizontal and Vertical position, Display units and Value decimal places.
For step-by-step instructions (with video’s and screenshots), visit our Knowledge Base and check the Tutorial: how to add Power BI Analytic lines available under each visual that supports Analytics lines. Or click the links below:
- Adding Analytic lines to a Dumbbell Bar (ColorBlind Friendly theme)
- Adding Analytic lines to a Dumbbell Column (ColorBlind Friendly theme)
- Adding Analytic lines to a Lipstick Bar
- Adding Analytic lines to a Lipstick Column
- Adding Analytic lines to a Lollipop Bar
- Adding Analytic lines to a Lollipop Column
- Adding Analytic lines to a Strip Plot
Try it yourself!
Do you want to try the Analytic lines in our visuals? Download any of the visuals available that support Analytics features from the Microsoft AppSource.
For any questions or remarks, please contact us by email at Nova Silva Support or visit our Community forum.