Posted on

PowerGantt Chart for Power BI – Update

We are excited to receive ongoing feedback from you and want to express our gratitude for your valuable contributions. Your insights help us make significant enhancements to our visuals.

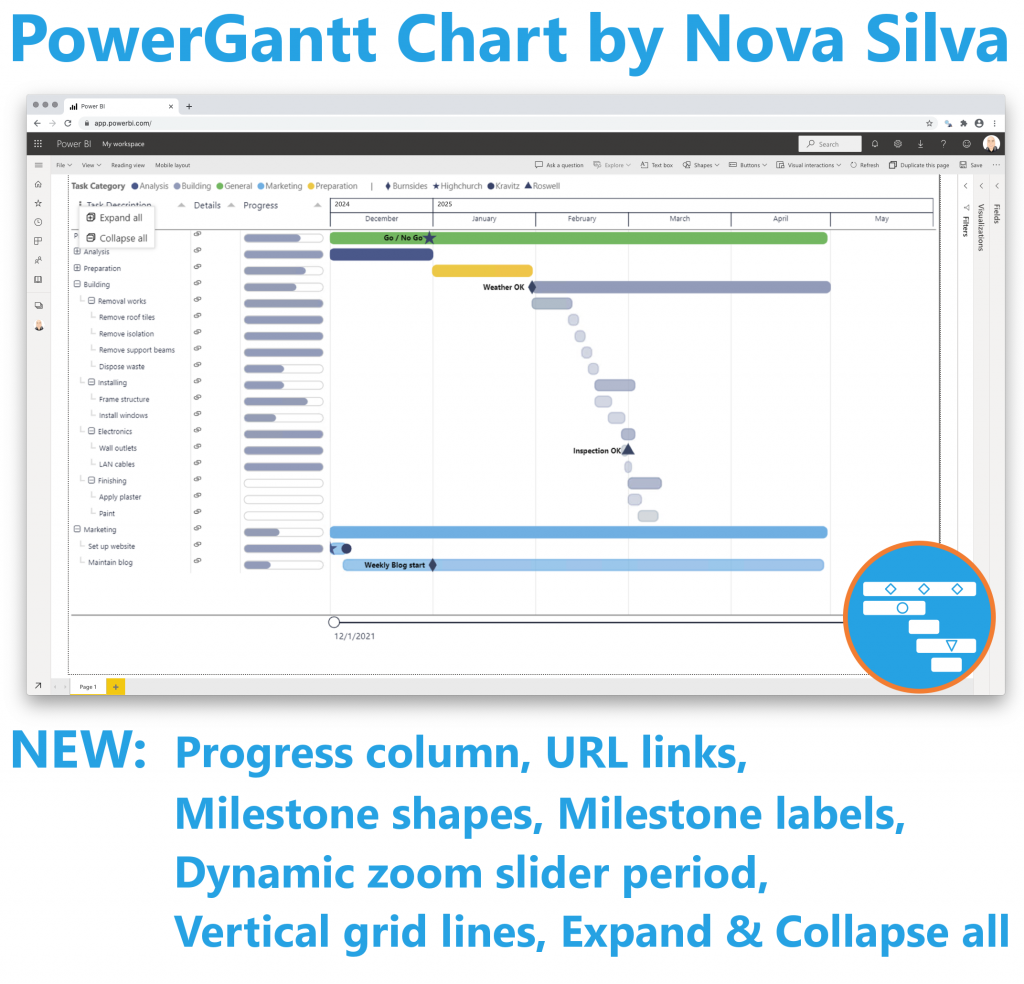
In the latest releases of the PowerGantt Chart, we have added many new features based on your feedback. These include the ability to show incomplete tasks and display progress as a separate column. We’ve also included links in the additional columns and enhanced their formatting options. You can now change the milestone shapes and wrap text in columns for better readability.

Additionally, we’ve added the option to preset the zoom slider, expand and collapse all hierarchy elements, and add milestone labels. To further improve your experience, we’ve enabled the display and formatting of vertical grid lines. These updates are designed to provide you with more flexibility and control over your project visuals.

We appreciate your continued support and look forward to receiving more of your valuable feedback. Together, we can keep enhancing PowerGantt Chart to meet your needs.

Try the PowerGantt Chart for FREE now on your own project data by downloading it from the AppSource.

Posted on

Attribute Control Chart for Power BI

Maintaining quality standards is a non-negotiable aspect of every successful operation. Enter the new Attribute Control Chart for Power BI, a robust mechanism for monitoring and controlling categorical data variations.

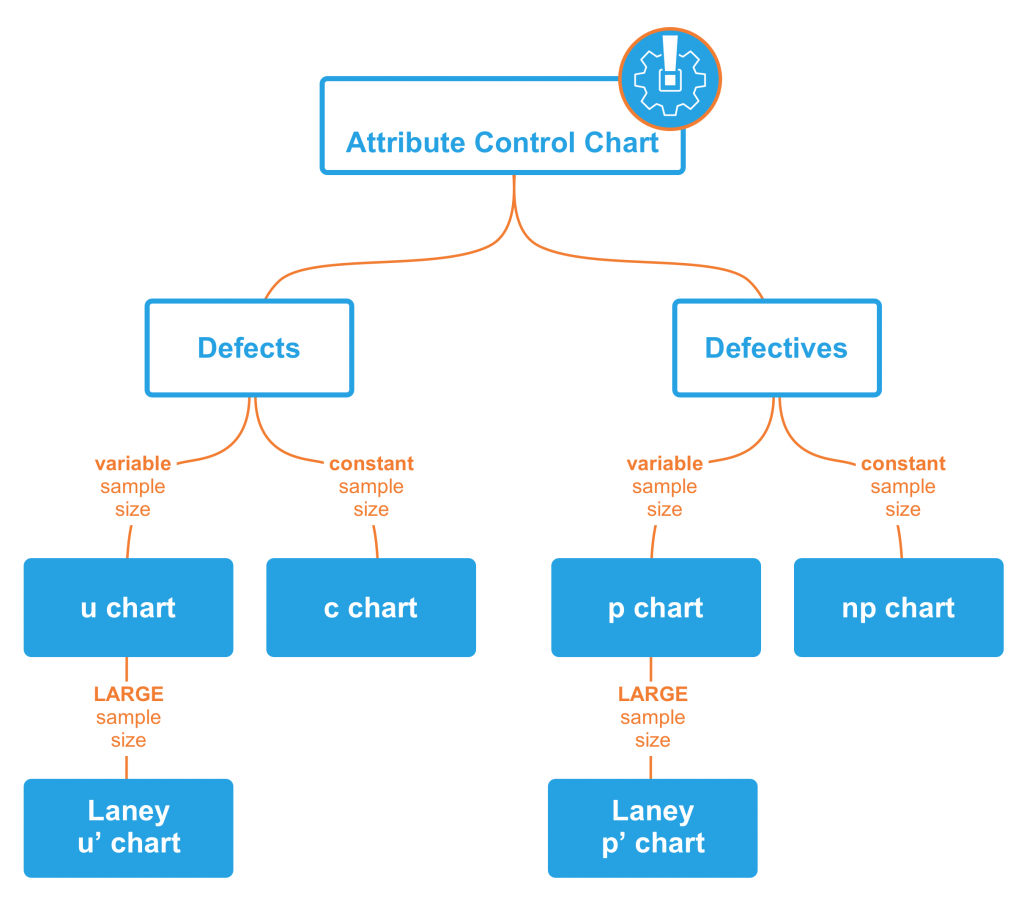
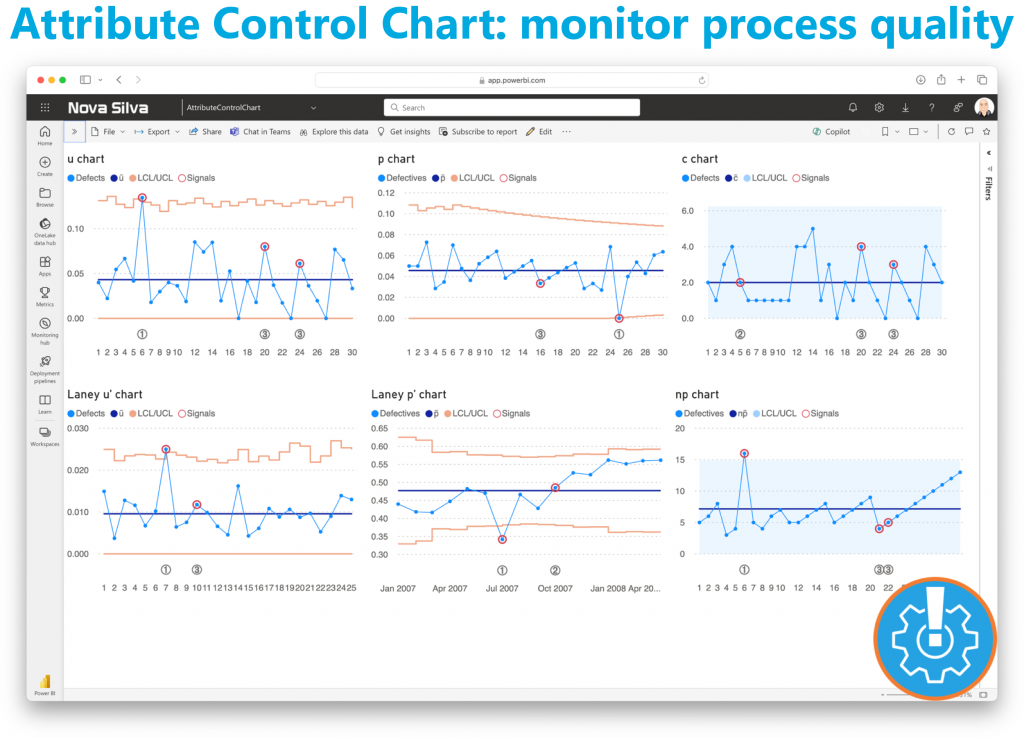
The Attribute Control Chart offers a comprehensive suite of six attribute charts to cater to diverse analytical needs:

  • c chart: Monitors number of defects per sample (sample size is constant).
  • u chart: Tracks the number of defects per unit (sample size varies).
  • Laney u’ chart: A modified version of the u chart to adjust for overdispersion or underdispersion in your data.
  • p chart: Observes the proportion of defective items per sample (sample size varies).
  • Laney p’ chart: A modified version of the p chart to adjust for overdispersion or underdispersion in your data.
  • np chart: Displays the count of defective items per sample (sample size is constant).

Power BI users can delve deeper into their data, facilitating timely decision-making and continuous improvement. From manufacturing to healthcare, the Attribute Control Chart equips organizations across industries with the insights needed to uphold quality standards and drive operational excellence.

Ready to experience the Attribute Control Chart? Download it from AppSource today and explore its capabilities with your own data – try for free!

Posted on

Milestone Trend Analysis Chart for Power BI – Update

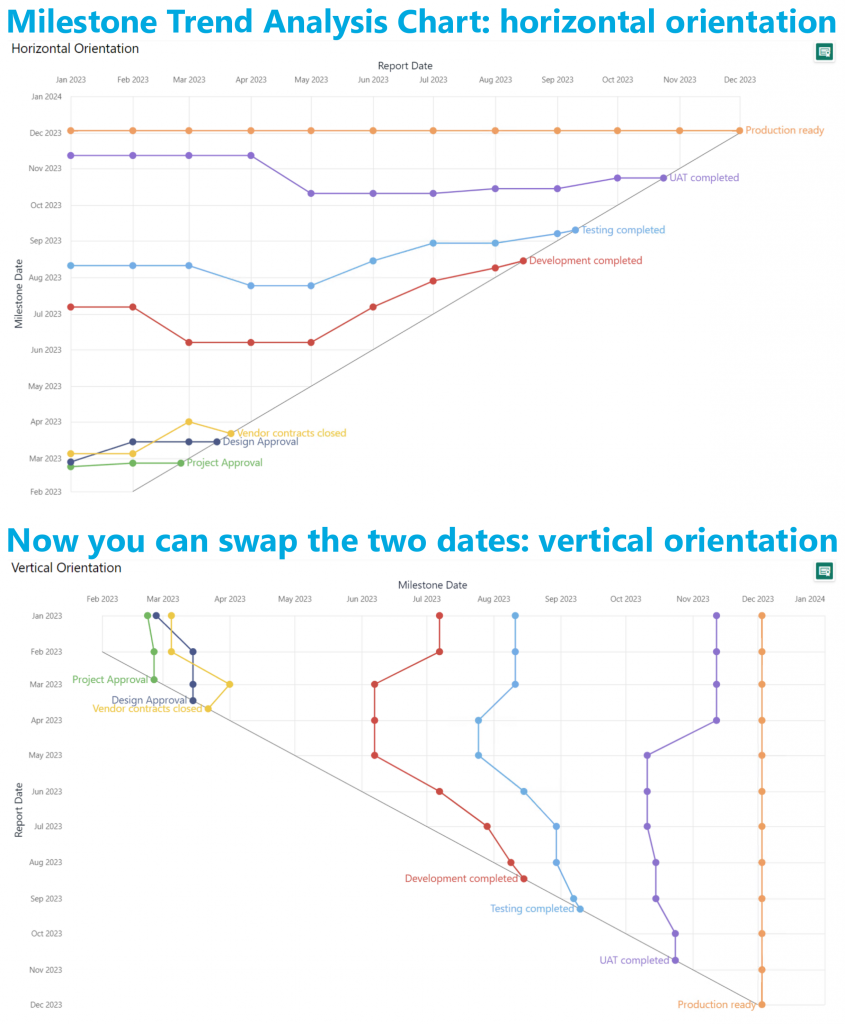
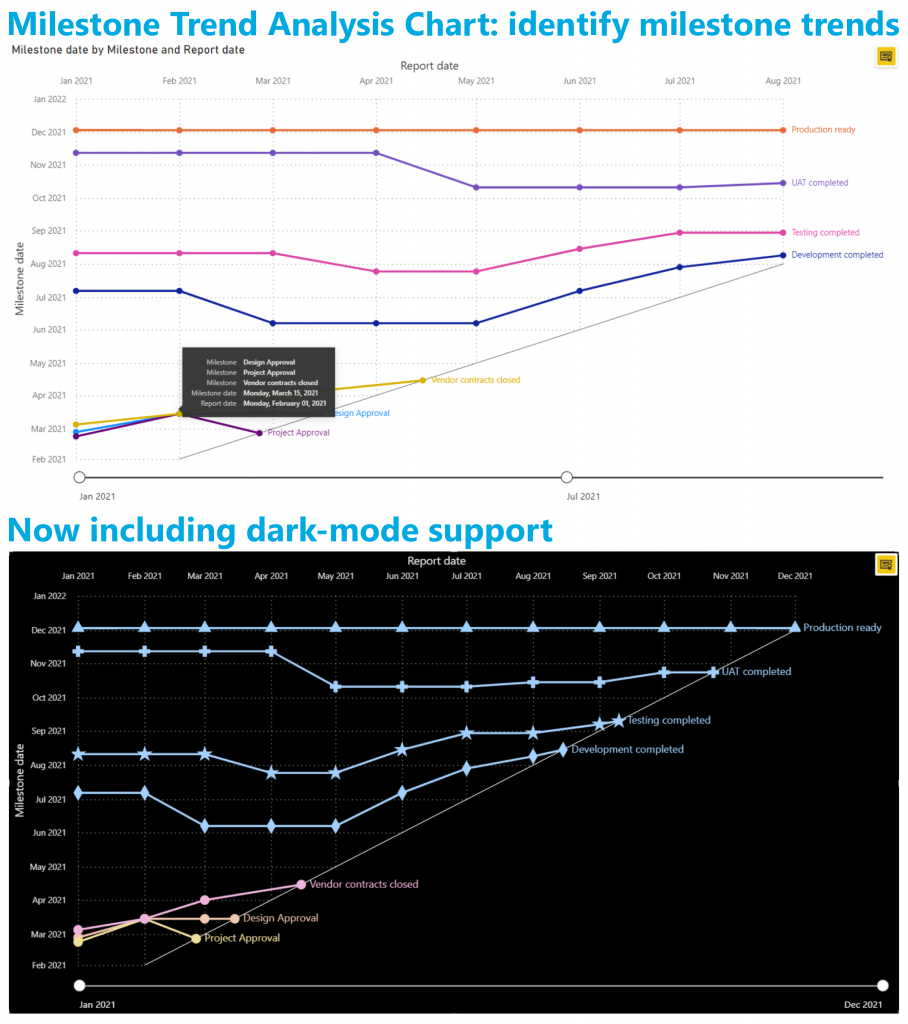
Exciting news! Thanks to your valuable feedback, we’ve enhanced our Milestone Trend Analysis Chart even further. We’re thrilled to announce that you can now switch between horizontal and vertical orientations, catering to your preferred visualization style.

The Milestone Trend Analysis (MTA) Chart remains your go-to tool for swiftly identifying deadline trends, empowering you to take timely corrective actions. With this update, we aim to enhance deadline awareness among project participants and stakeholders alike.

In our latest version, seamlessly navigate between horizontal and vertical views within the familiar Power BI interface. No need to adapt to a new user interface – enjoy the same ease of use with added flexibility. Plus, benefit from supported features like themes, interactive selection, and tooltips.

What’s more, ours is the only Microsoft Certified Milestone Trend Analysis Chart for Power BI, ensuring reliability and compatibility with the platform.

Ready to experience the enhanced Milestone Trend Analysis Chart? Download it from AppSource today and explore its capabilities with your own data – try for free!

Posted on

Dumbbell Bar Chart for Power BI – AE Timeline Plot

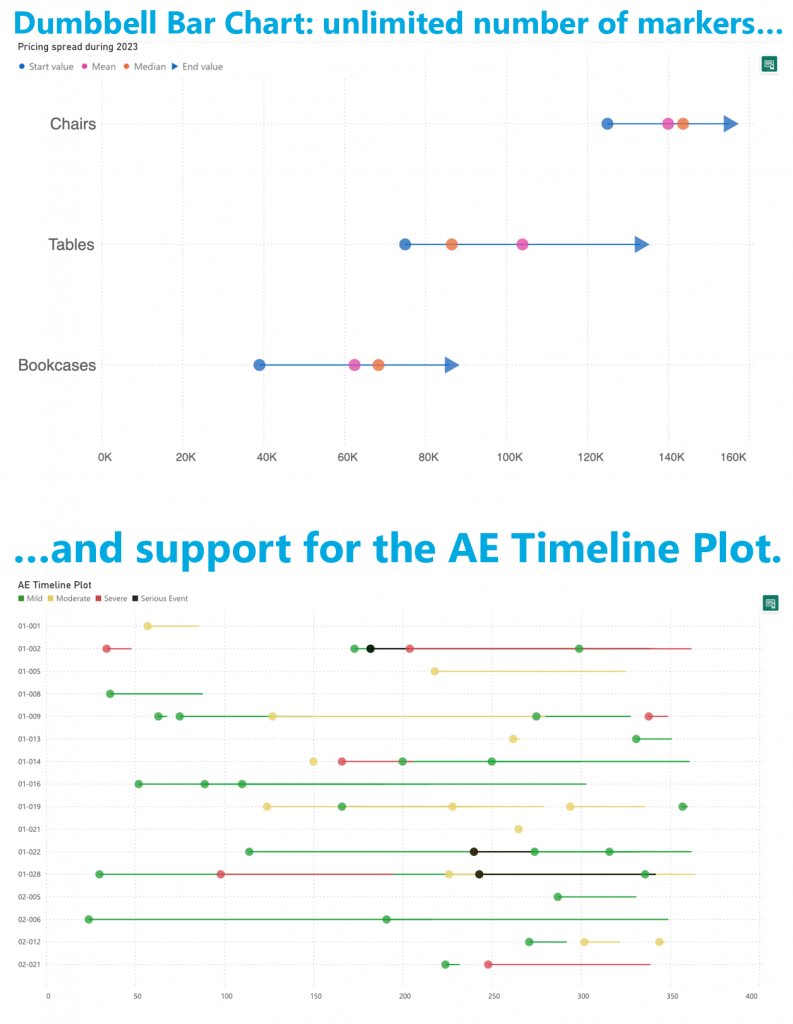
Your valuable feedback continues to shape our Power BI visuals, and we’re thrilled to announce exciting enhancements to the Dumbbell Bar Chart. In the latest release, we’ve introduced the capability to display multiple dumbbell bars on a single row, allowing for the presentation of more than two values in a streamlined manner. This update opens up new possibilities, including the creation of the Adverse Event Timeline plot, or AE Timeline.

The AE Timeline serves as a graphical representation of the timing of adverse events in clinical trials or studies. Its primary objective is to visually convey when adverse events occurred concerning the timing of treatment or exposure. Widely used in medical research, especially during safety data analysis in drug development, the AE Timeline is now seamlessly available within Power BI.

Experience the enhanced Dumbbell Bar Chart and the innovative AE Timeline by downloading it from AppSource. All features are readily accessible within Power BI Desktop, empowering you to evaluate this visual on your own data. Dive into the enhanced functionality and discover new insights effortlessly.

Posted on

Control Chart XmR for Power BI – Update

Years ago, Stacey Barr introduced us to the magic of Control Charts. Magic it is, because it allows everyone to split their temporal data in two: random noise and real signals. And we all are looking for real signals, and don’t want to be distracted by random noise.

In our last release of the Control Chart XmR we have added several new features to make it even easier to find real signals and ignore random noise in your data.

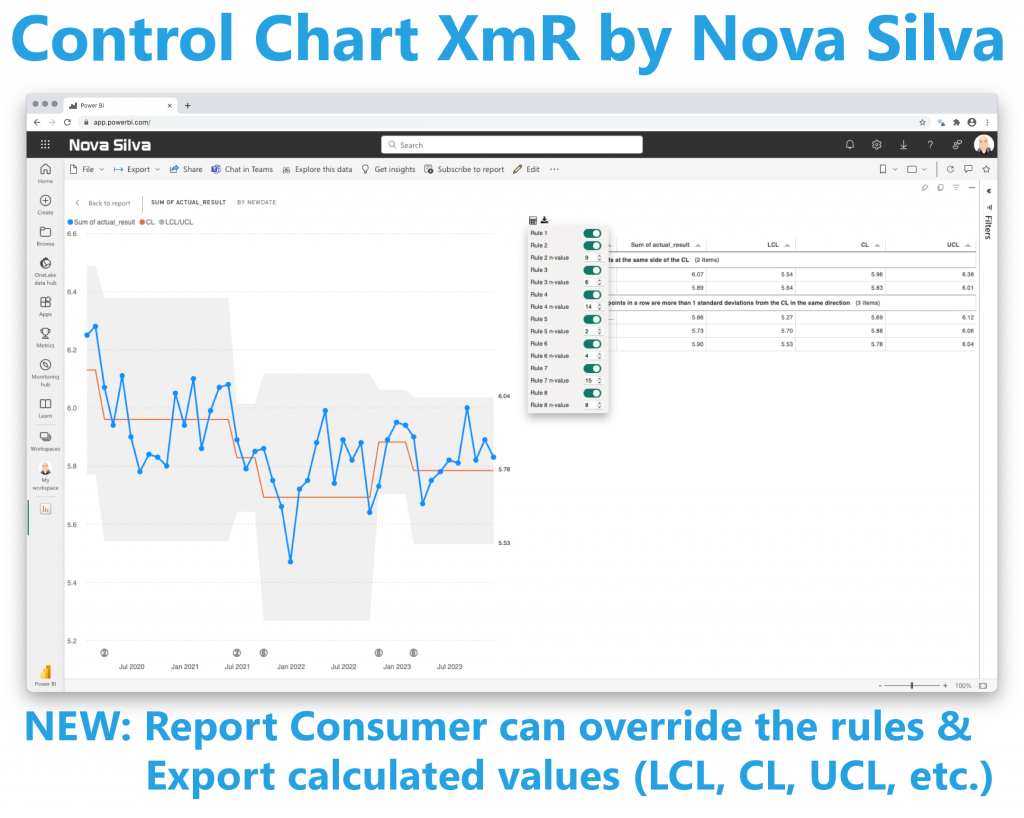
First, we added a feature to allow any report consumer to override the applied rules. This allows everyone to analyze the effects of one specific rule or set of rules.

Several customers asked for a possibility to download the calculated values from the visual. Now you can download all values calculated by the Control Chart XmR, like: LCL, CL, UCL, sigma’s and signals.

Don’t hesitate and try the new Control Chart XmR now on your own data by downloading it from the AppSource. All features are available for free to evaluate this visual within Power BI Desktop.

Posted on

PowerGantt Chart for Power BI – Update

We are delighted to receive ongoing feedback from you, and we want to express our gratitude for your valuable contributions. Your insights help us to make significant enhancements to our visuals.

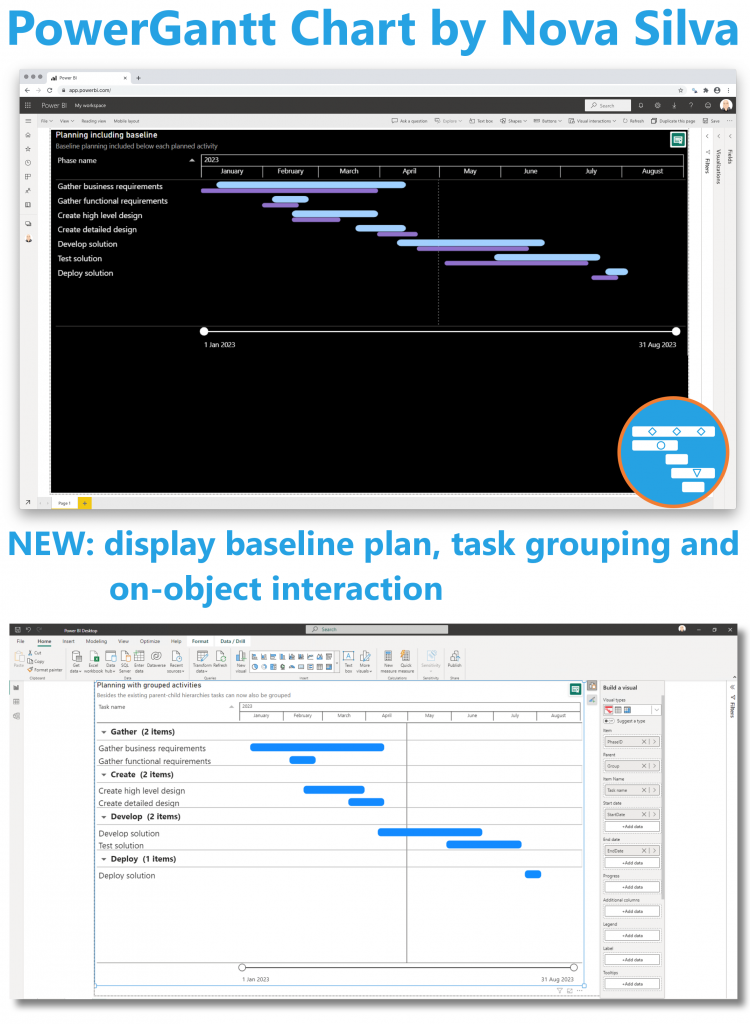
In the last version of the PowerGantt Chart, we have added a new feature that allows you to include a baseline planning. You can view the baseline planning as a thinner bar located beneath the main task bar. In the image below, the purple bar represents the baseline planning.

Besides supporting parent-child hierarchies, the PowerGantt Chart now allows you to group tasks by any categorical variable.

As part of our commitment to support the standard Power BI user interface, we have added a number of exciting new Power BI features to all our visuals: On-object interaction, subtitle and divider.

We are confident these enhancements will improve your experience with the PowerGantt Chart and enable you to achieve your goals more efficiently. Thank you for your continued support, and we look forward to bringing you more exciting updates in the future.

Try the PowerGantt Chart for FREE now on your own project data by downloading it from the AppSource.

Posted on

Milestone Trend Analysis Chart for Power BI – Update

Based on your excellent feedback we have been able to further improve the Milestone Trend Analysis Chart.

Milestone Trend Analysis (MTA) is a simple method of early identifying deadline trends. It allows you to react in time with corrective actions. And it will raise the deadline awareness of all project participants and stakeholders.

Key updates in the Milestone Trend Analysis Chart are:

  • Zoom slider support to allow for easy navigation through time
  • Support for different marker icons
  • Direct labeling: allow the user to use series labels to replace the legend
  • Tooltip will include details of all overlapping markers
  • AppSource eCommerce transactability: purchase and manage your licenses like any Microsoft license
  • Dark mode support: all elements can be formatted to support a dark background

The Milestone Trend Analysis Chart makes use of the familiar standard Power BI user interface. No need to learn a new interface. Themes, interactive selection and tooltips are supported.

Don’t hesitate and try the Milestone Trend Analysis Chart now on your own data by downloading it from the AppSource. All features are available for free to evaluate this visual within Power BI Desktop.

Posted on

Exploring the Milestone Trend Analysis

Exploring the Milestone Trend Analysis

The Milestone Trend Analysis (MTA) is a simple method of early identifying deadline trends. It allows you to react in time with corrective actions. And it will raise the deadline awareness of all project participants and stakeholders.

Microsoft MVP Erik van Hurck reviews the Milestone Trend Analysis. Have a look at the video here

Try it yourself!

Do you want to try the Milestone Trend Analysis (MTA)? Download a trial from the Microsoft AppSource.

Posted on

PowerGantt Chart for Power BI – Update

Earlier this year we introduced the PowerGantt Chart. We would like to thank you all for your excellent feedback and suggestions.

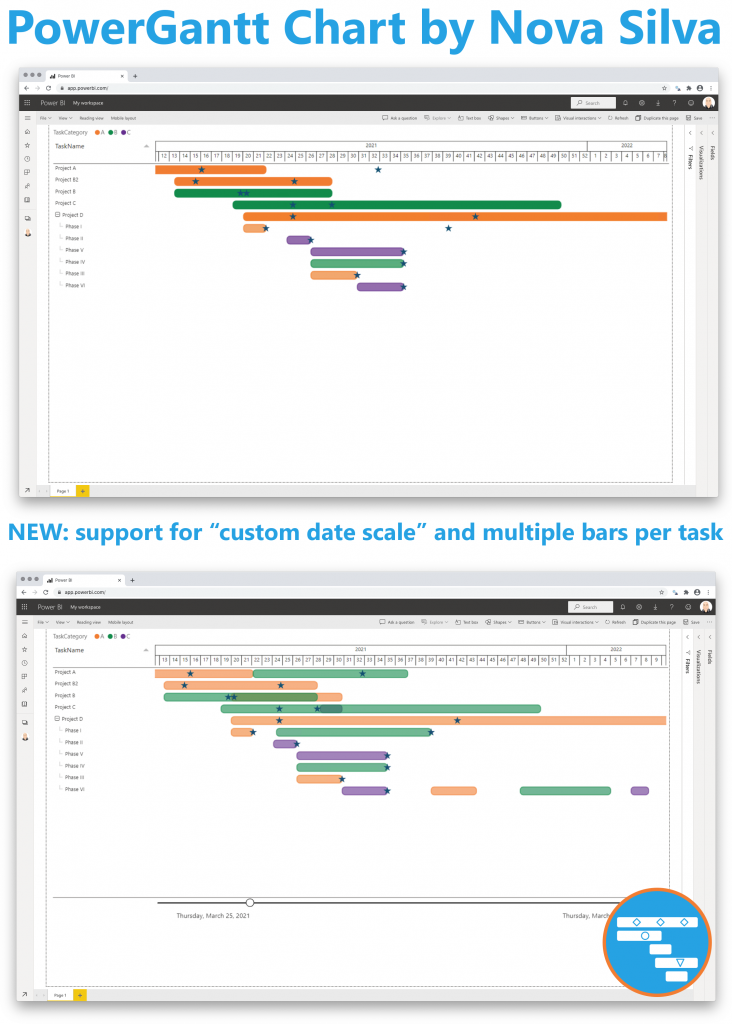
One suggestion we received from several users was to add a custom-date-scale to the PowerGantt Chart. This would significantly increase the number of possibilities, because there are unlimited number of custom date/time scales, like: fiscal years, special week numbers, AM/PM split of the day, etc.

Just after summer we released a new version of the PowerGantt containing this feature. You could already include unlimited number of tasks, hierarchy levels and milestones. Now every user of the PowerGantt can also define and include their own custom date scale.

Because the definition of a custom-date-scale requires the setup of a date table, we have created an instruction video where you’ll learn how to create your own custom date scale in a couple of easy steps. You can find this tutorial video HERE.

Don’t hesitate and try the PowerGantt Chart for FREE now on your own project/program data by downloading it from the AppSource.