PowerGantt Chart for Power BI – November 2025 Update
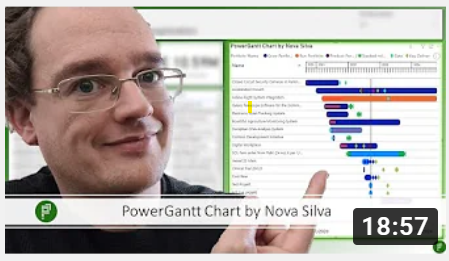
- We’re thrilled to introduce one of the most requested features in Power Gantt: task dependencies! With our latest release, you can now add Finish-to-Start (FS) dependencies between tasks—visually represented as arrows connecting one task’s finish to another’s start.
- This powerful enhancement brings true project scheduling capability to Power BI. By visualizing dependencies, teams can better understand task sequences, identify bottlenecks, and manage timelines more effectively.
- Adding dependencies is simple—just define them in your dataset, and Power Gantt does the rest. Arrows will automatically appear on your Gantt chart, making relationships between tasks clear and actionable.

Whether you’re managing product launches, construction schedules, or complex workflows, FS dependencies make your Power Gantt chart smarter, more dynamic, and easier to interpret.
Start using dependencies today and take your project tracking to the next level!
Try the Power Gantt Chart for FREE now on your own project data by downloading it from the AppSource.
Questions or remarks? Visit us at: Power Gantt Chart for Power BI.


