Strip Plot for Power BI – April 2025 Update
The Strip Plot is an essential tool for uncovering patterns in categorical and numerical data, allowing users to visualize the distribution of individual data points effectively. With our latest update, we’ve supercharged the Strip Plot with powerful new features that enhance clarity and flexibility.
What’s new?
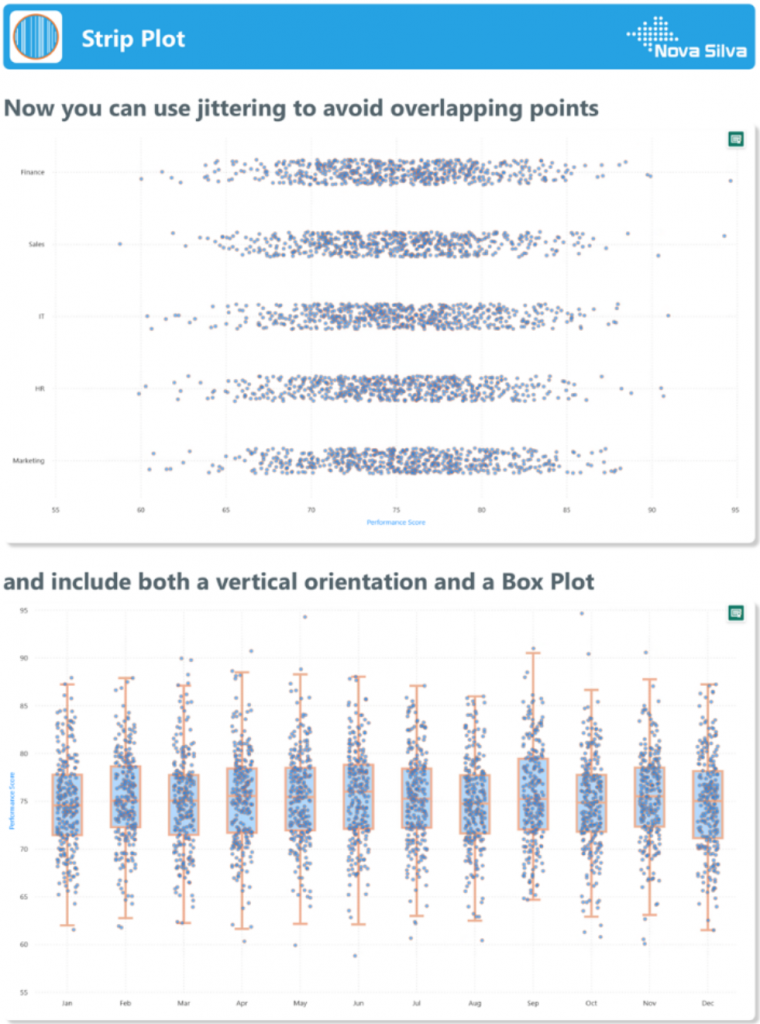
- Jittering – Say goodbye to overlapping points! Jittering slightly shifts data points to improve visibility, ensuring that every value in your dataset is accounted for.
- Box plot – Combine summary statistics with raw data by overlaying a box plot on your strip plot. Now, you can easily spot medians, quartiles, and outliers while maintaining full visibility of individual data points.
- Vertical layout – Previously limited to horizontal orientation, the Strip Plot now supports a vertical layout, making it even more versatile for different analytical needs.
These enhancements empower users to gain deeper insights from their data, making trend identification and anomaly detection easier than ever. Try the updated Strip Plot in Power BI today and take your visual analytics to the next level! Download it now from the AppSource.
Questions or remarks? Visit us at: https://visuals.novasilva.com/.