
Description
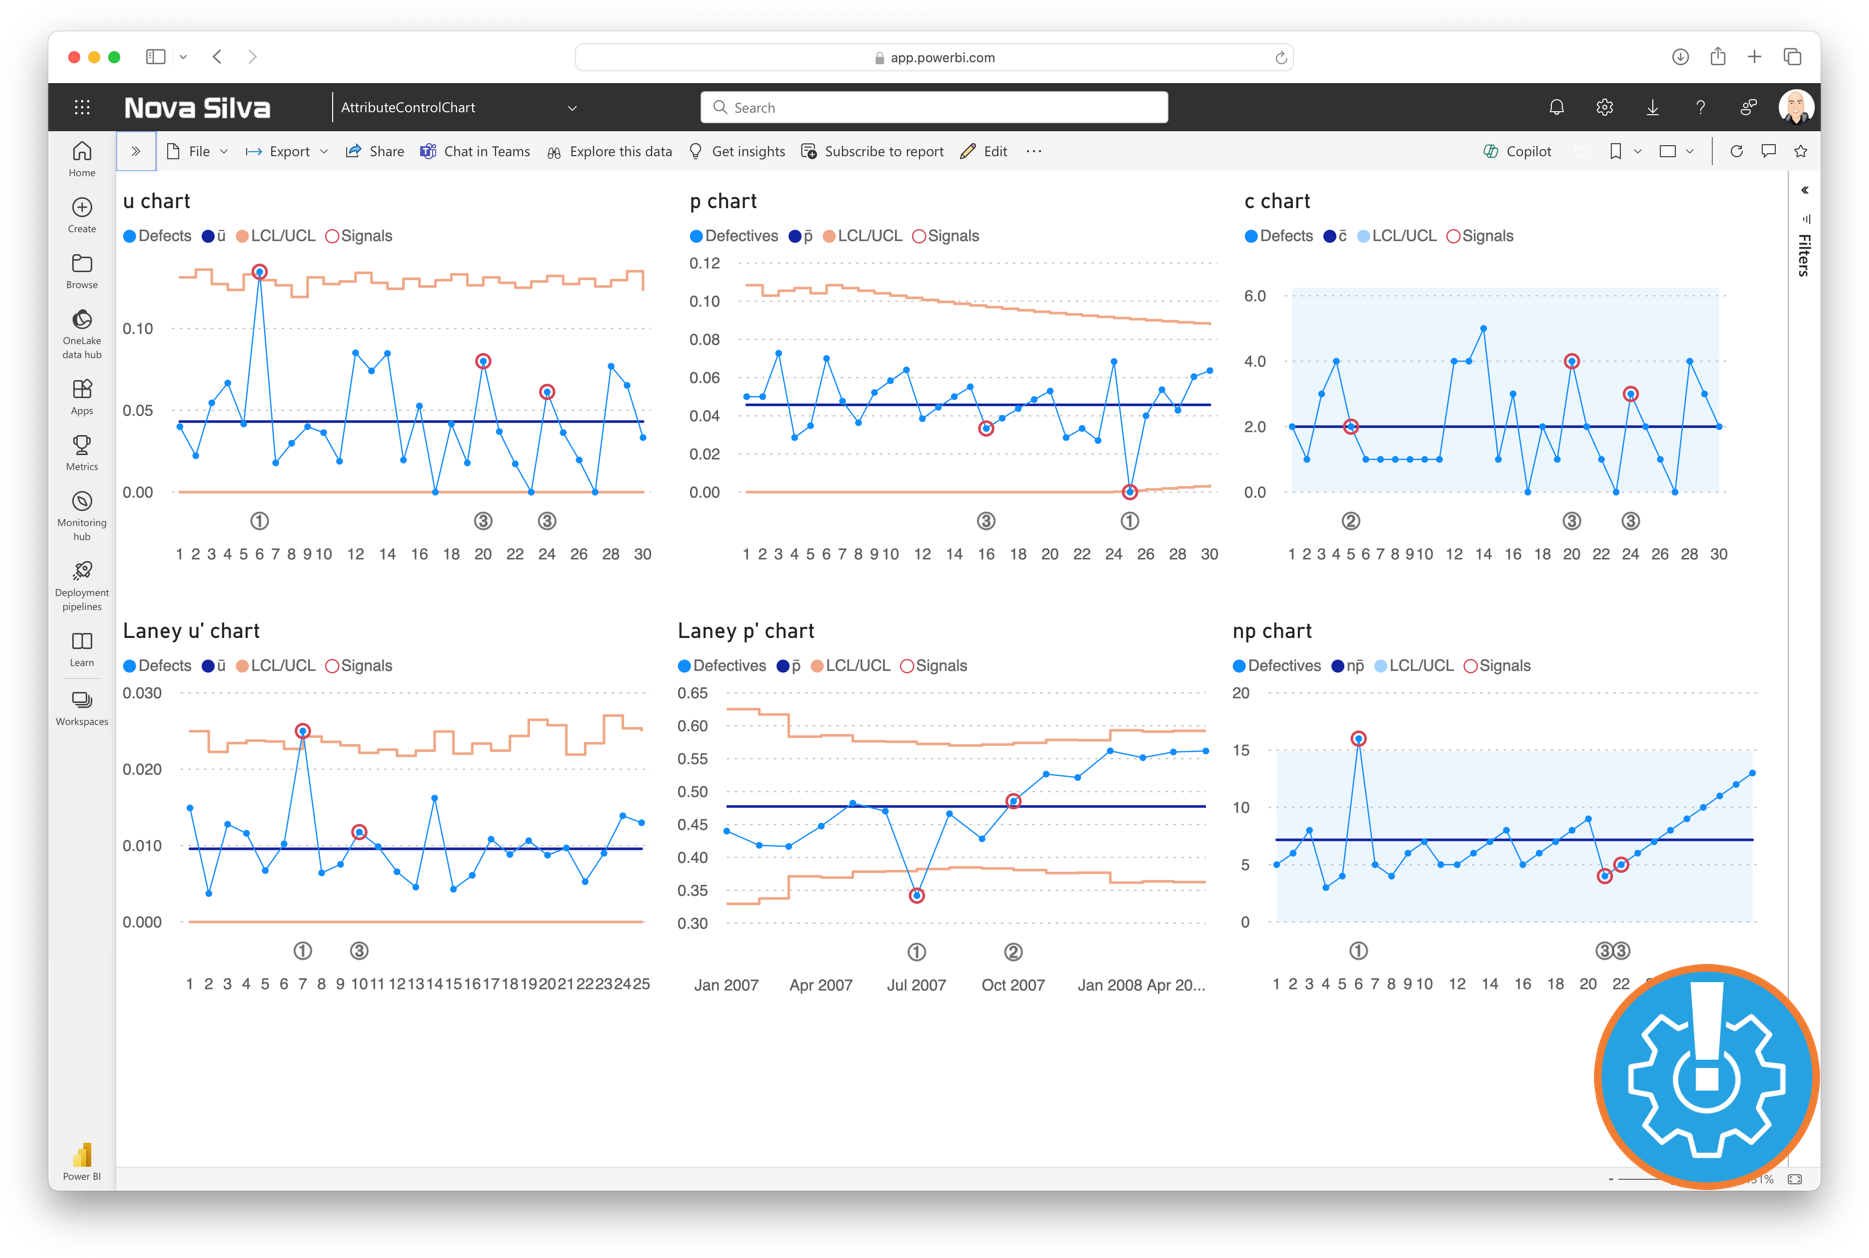
The Attribute Control Chart in Power BI offers a comprehensive view of process quality by allowing users to monitor defects/defectives and their corresponding metrics. This visual supports six types of Attribute Control Charts, including:
- c chart: Monitors the number of defects in each sample when the sample size is constant.
- u chart: Tracks the number of defects per unit when the sample size varies.
- Laney u’ chart: A modified version of the u chart to adjust for overdispersion or underdispersion in your data.
- p chart: Observes the proportion of defective items in each sample when the sample size varies.
- Laney p’ chart: A modified version of the p chart to adjust for overdispersion or underdispersion in your data.
- np chart: Displays the count of defective items in each sample when the sample size is constant.
Benefits
- Improved process visibility: Offers a visually intuitive representation of process performance, empowering users to make data-driven decisions and drive continuous improvement initiatives.
- Early detection of anomalies: Enables early detection of deviations from expected performance levels, helping to mitigate quality issues and prevent costly defects.
- Enhanced collaboration: Facilitates collaboration and communication among cross-functional teams by providing a shared understanding of process performance metrics and trends.
Sample use cases
- Manufacturing: Monitor defect rates in production lines to ensure product quality and reduce waste.
- Healthcare: Track the occurrence of adverse events or medical errors to enhance patient safety and care quality.
- Customer Service: Analyze the frequency of customer complaints or service errors to identify areas for process improvement and enhance customer satisfaction.
Key Features of the Attribute Control Chart
-
- Dynamic data analysis: Users can explore and analyze data trends by filtering and slicing data based on various attributes such as time periods, product categories, or production lines.
- Statistical control limits: The visual dynamically calculates and displays control limits, allowing users to quickly identify variations in the process and distinguish between common cause and special cause variations.
- Automatic signal detection: The visual automatically detects significant signals in your data, allowing users to focus on signals and ignore random noise.
- Format the objects: All lines, markers and axes can be formatted independently, and support theme settings.
- Selection & highlighting: Like any standard Power BI Chart you can make use of the Selection & Highlighting functions within the Attribute Control Chart.
- Full tooltip support: Besides the default Tooltip behaviour (show the value of the element you hover) you can also add additional fields to the tooltip.
- Full bookmark support: like any of the standard visuals the Attribute Control Chart supports Bookmarks.
- Drill-Down capability: Users can drill down into specific data points to investigate underlying factors contributing to quality issues or improvements.
- Real-Time monitoring: Provides real-time updates as new data is ingested, enabling users to stay informed about process performance and take timely corrective actions.
Watch the video tutorial of the Attribute Control Chart for Power BI HERE. Do you want to try the Attribute Control Chart yourself? Download it from the Microsoft AppSource for free.