We are excited to receive ongoing feedback from you and want to express our gratitude for your valuable contributions. Your insights help us make significant enhancements to our visuals.
In the latest releases of the PowerGantt Chart, we have added many new features based on your feedback. These include the ability to show incomplete tasks and display progress as a separate column. We’ve also included links in the additional columns and enhanced their formatting options. You can now change the milestone shapes and wrap text in columns for better readability.
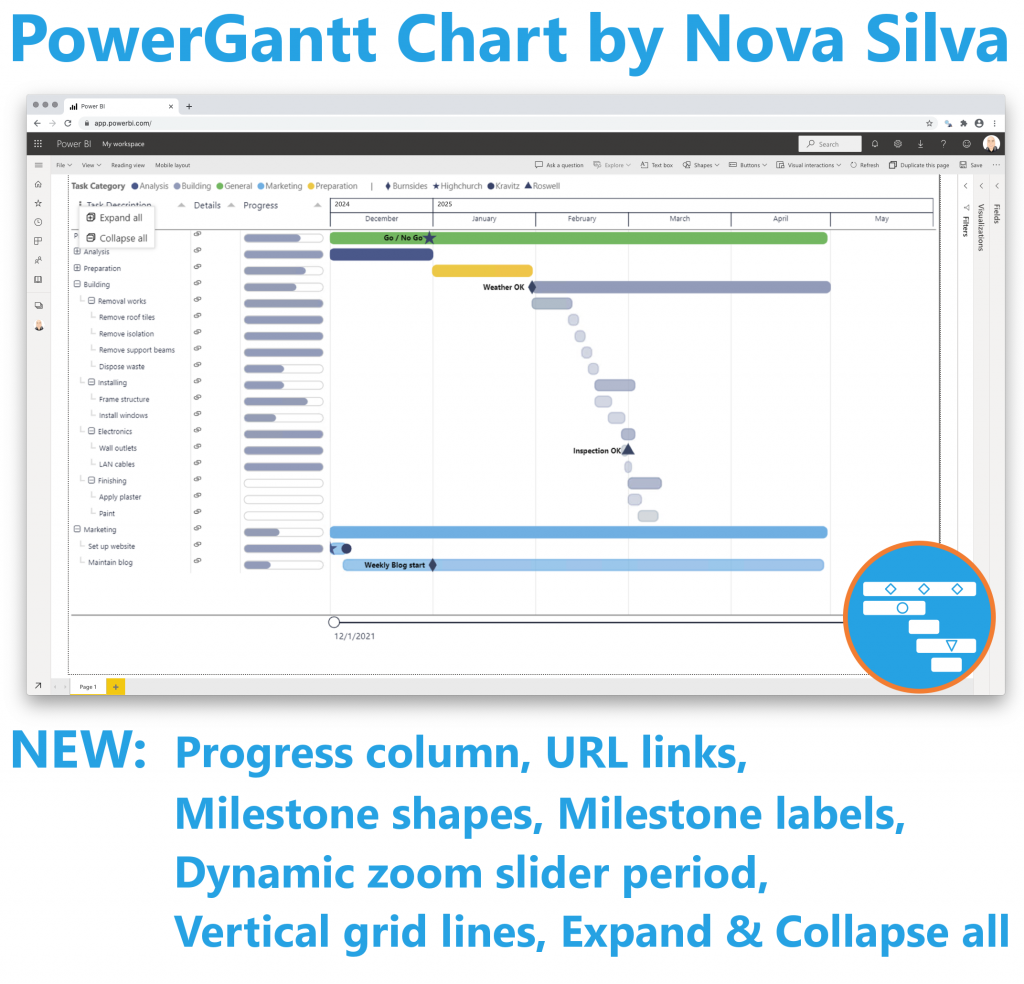
Additionally, we’ve added the option to preset the zoom slider, expand and collapse all hierarchy elements, and add milestone labels. To further improve your experience, we’ve enabled the display and formatting of vertical grid lines. These updates are designed to provide you with more flexibility and control over your project visuals.
We appreciate your continued support and look forward to receiving more of your valuable feedback. Together, we can keep enhancing PowerGantt Chart to meet your needs.
Try the PowerGantt Chart for FREE now on your own project data by downloading it from the AppSource.