We are delighted to receive ongoing feedback from you, and we want to express our gratitude for your valuable contributions. Your insights help us to make significant enhancements to our visuals.
In the last version of the PowerGantt Chart, we have added a new feature that allows you to include a baseline planning. You can view the baseline planning as a thinner bar located beneath the main task bar. In the image below, the purple bar represents the baseline planning.
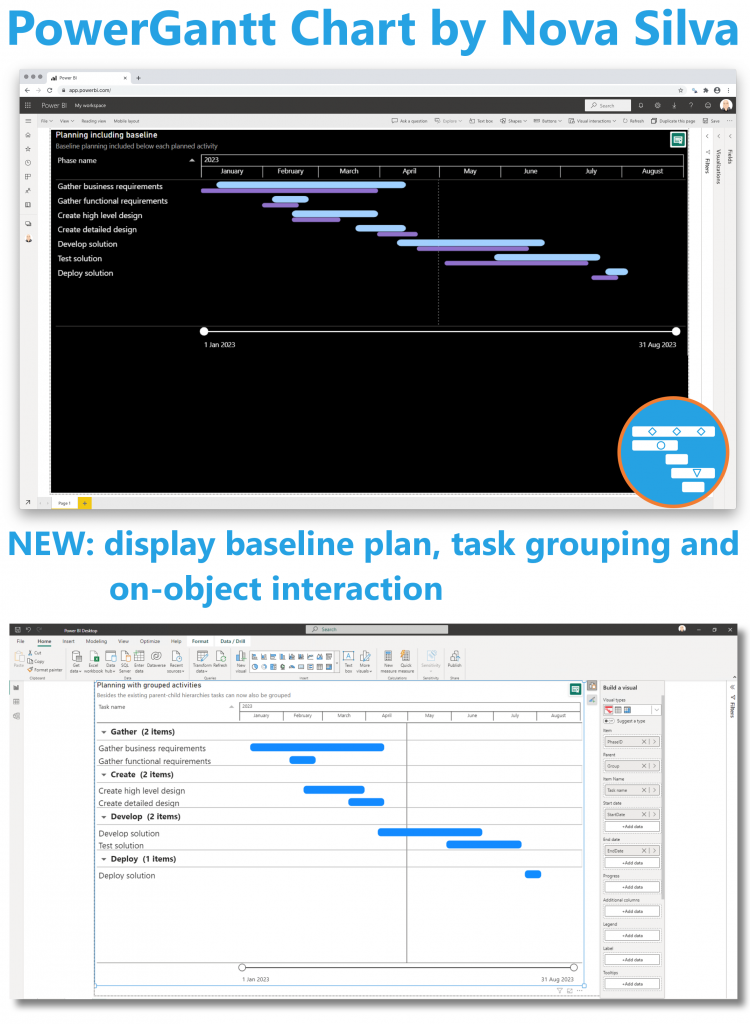
Besides supporting parent-child hierarchies, the PowerGantt Chart now allows you to group tasks by any categorical variable.
As part of our commitment to support the standard Power BI user interface, we have added a number of exciting new Power BI features to all our visuals: On-object interaction, subtitle and divider.
We are confident these enhancements will improve your experience with the PowerGantt Chart and enable you to achieve your goals more efficiently. Thank you for your continued support, and we look forward to bringing you more exciting updates in the future.
Try the PowerGantt Chart for FREE now on your own project data by downloading it from the AppSource.