Exciting news! Thanks to your valuable feedback, we’ve enhanced our Milestone Trend Analysis Chart even further. We’re thrilled to announce that you can now switch between horizontal and vertical orientations, catering to your preferred visualization style.
The Milestone Trend Analysis (MTA) Chart remains your go-to tool for swiftly identifying deadline trends, empowering you to take timely corrective actions. With this update, we aim to enhance deadline awareness among project participants and stakeholders alike.
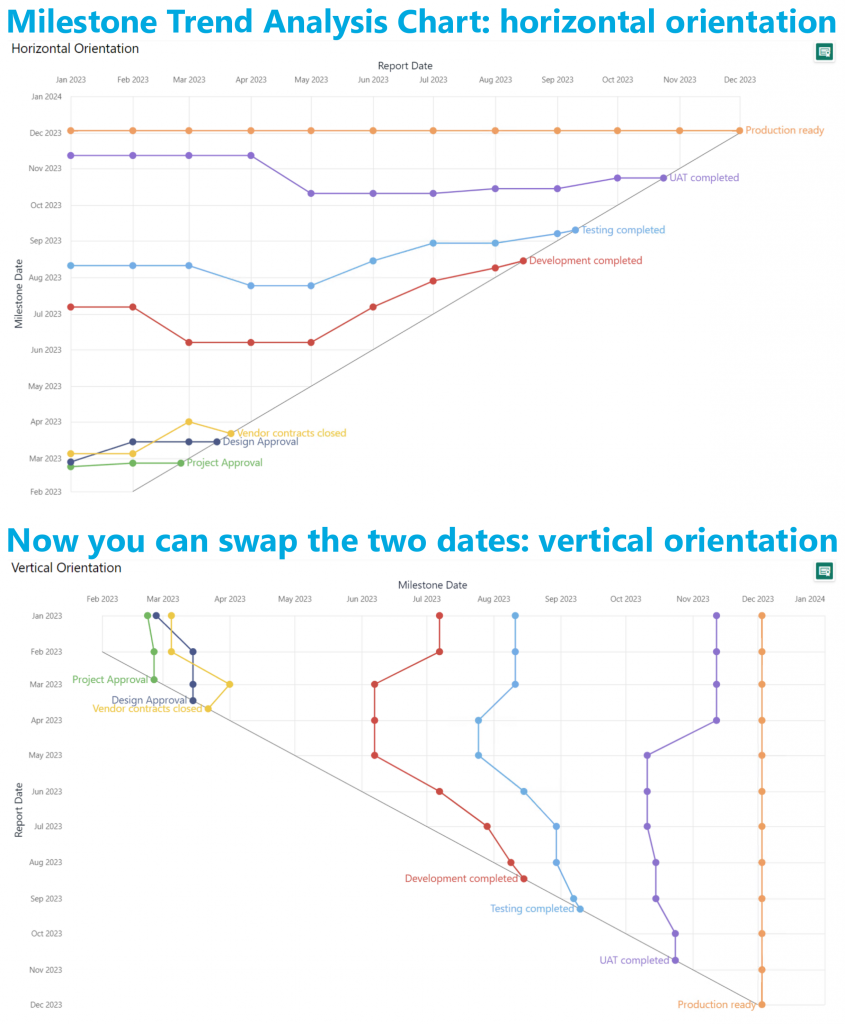
In our latest version, seamlessly navigate between horizontal and vertical views within the familiar Power BI interface. No need to adapt to a new user interface – enjoy the same ease of use with added flexibility. Plus, benefit from supported features like themes, interactive selection, and tooltips.
What’s more, ours is the only Microsoft Certified Milestone Trend Analysis Chart for Power BI, ensuring reliability and compatibility with the platform.
Ready to experience the enhanced Milestone Trend Analysis Chart? Download it from AppSource today and explore its capabilities with your own data – try for free!