Based on your excellent feedback we have been able to further improve the Milestone Trend Analysis Chart.
Milestone Trend Analysis (MTA) is a simple method of early identifying deadline trends. It allows you to react in time with corrective actions. And it will raise the deadline awareness of all project participants and stakeholders.
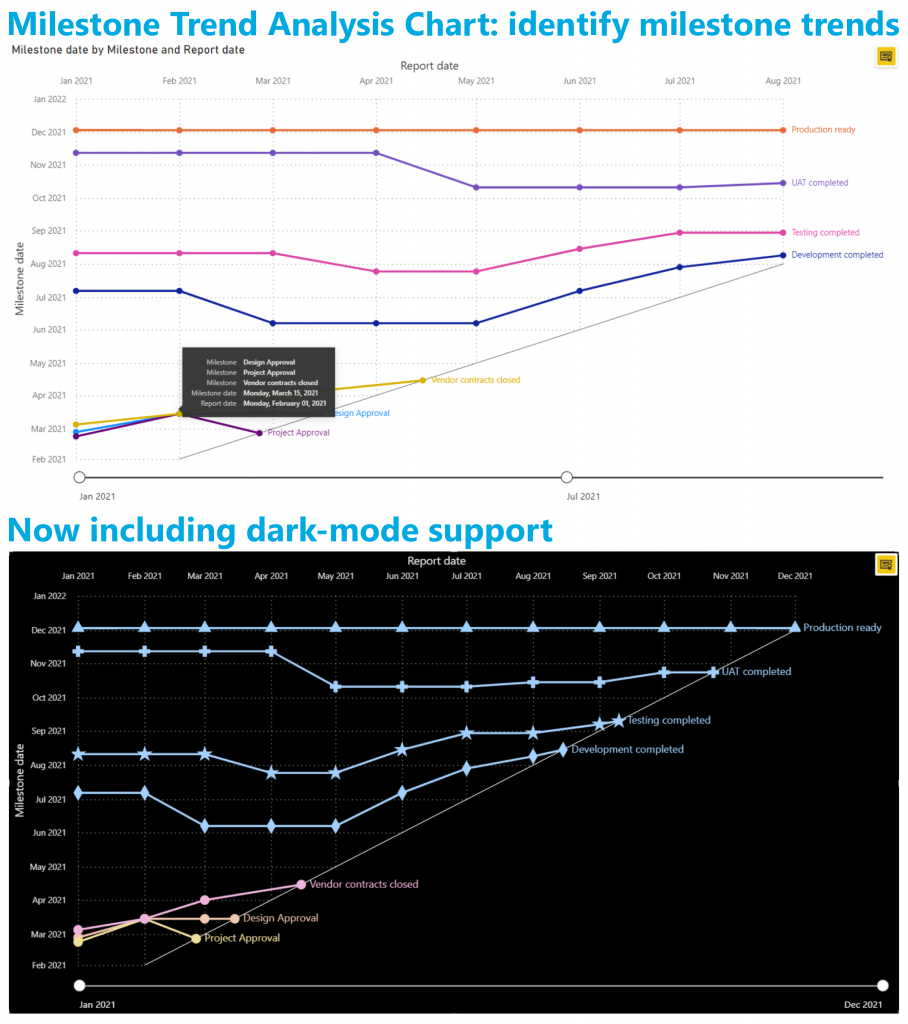
Key updates in the Milestone Trend Analysis Chart are:
- Zoom slider support to allow for easy navigation through time
- Support for different marker icons
- Direct labeling: allow the user to use series labels to replace the legend
- Tooltip will include details of all overlapping markers
- AppSource eCommerce transactability: purchase and manage your licenses like any Microsoft license
- Dark mode support: all elements can be formatted to support a dark background
The Milestone Trend Analysis Chart makes use of the familiar standard Power BI user interface. No need to learn a new interface. Themes, interactive selection and tooltips are supported.
Don’t hesitate and try the Milestone Trend Analysis Chart now on your own data by downloading it from the AppSource. All features are available for free to evaluate this visual within Power BI Desktop.