Milestones in project management are points in time when important deliverables are due. Like begin/end dates of project phases, formal approvals, etc. Nothing new to most of us.
How can we use milestones to monitor the progress of our project(s)? The Milestone Trend Analysis Chart for Power BI.
Milestone Trend Analysis (MTA) is a simple method of early identifying deadline trends. It allows you to react in time with corrective actions. And it will raise the deadline awareness of all project participants and stakeholders.
Key signals in the Milestone Trend Analysis Chart are:
- Horizontal line: no change in the (expected) completion date
- Increasing line: delay in the (expected) completion date
- Decreasing line: (expected) completion date brought forward
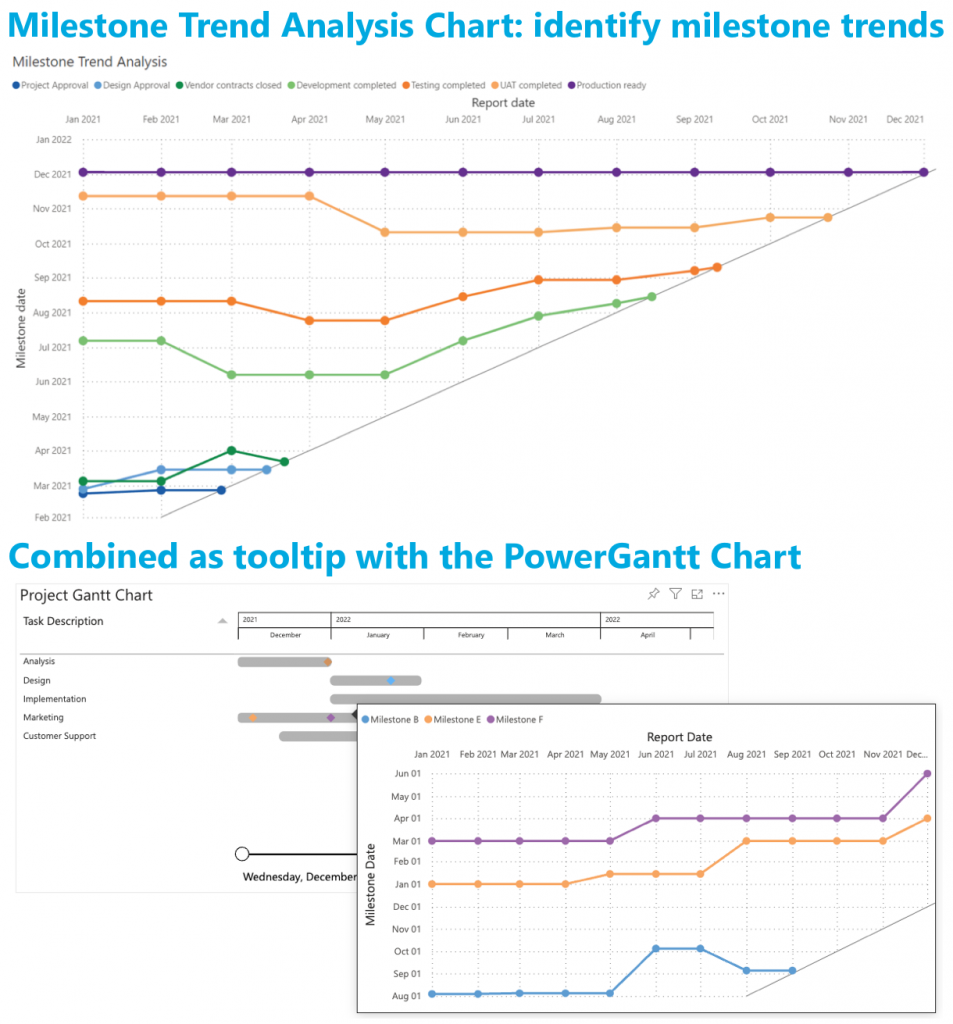
All features of the Milestone Trend Analysis Chart are available in the familiar standard Power BI user interface. No need to learn a new interface. And of course, themes, interactive selection and tooltips are supported.
Don’t hesitate and try the Milestone Trend Analysis Chart now on your own data by downloading it from the AppSource. All features are available for free to evaluate this visual within Power BI Desktop.