
Tutorial: Adding Custom Icons to Milestones
The Milestone Trend Analysis chart supports custom icons, giving report authors additional flexibility to align visuals with their organization’s branding. Icons need to be provided as Base64-encoded images, including the necessary metadata header.
There are two ways to convert your icon to Base64:
- Convert using Power Query (M Query)
- Convert using an external tool
Convert using Power Query (M Query)
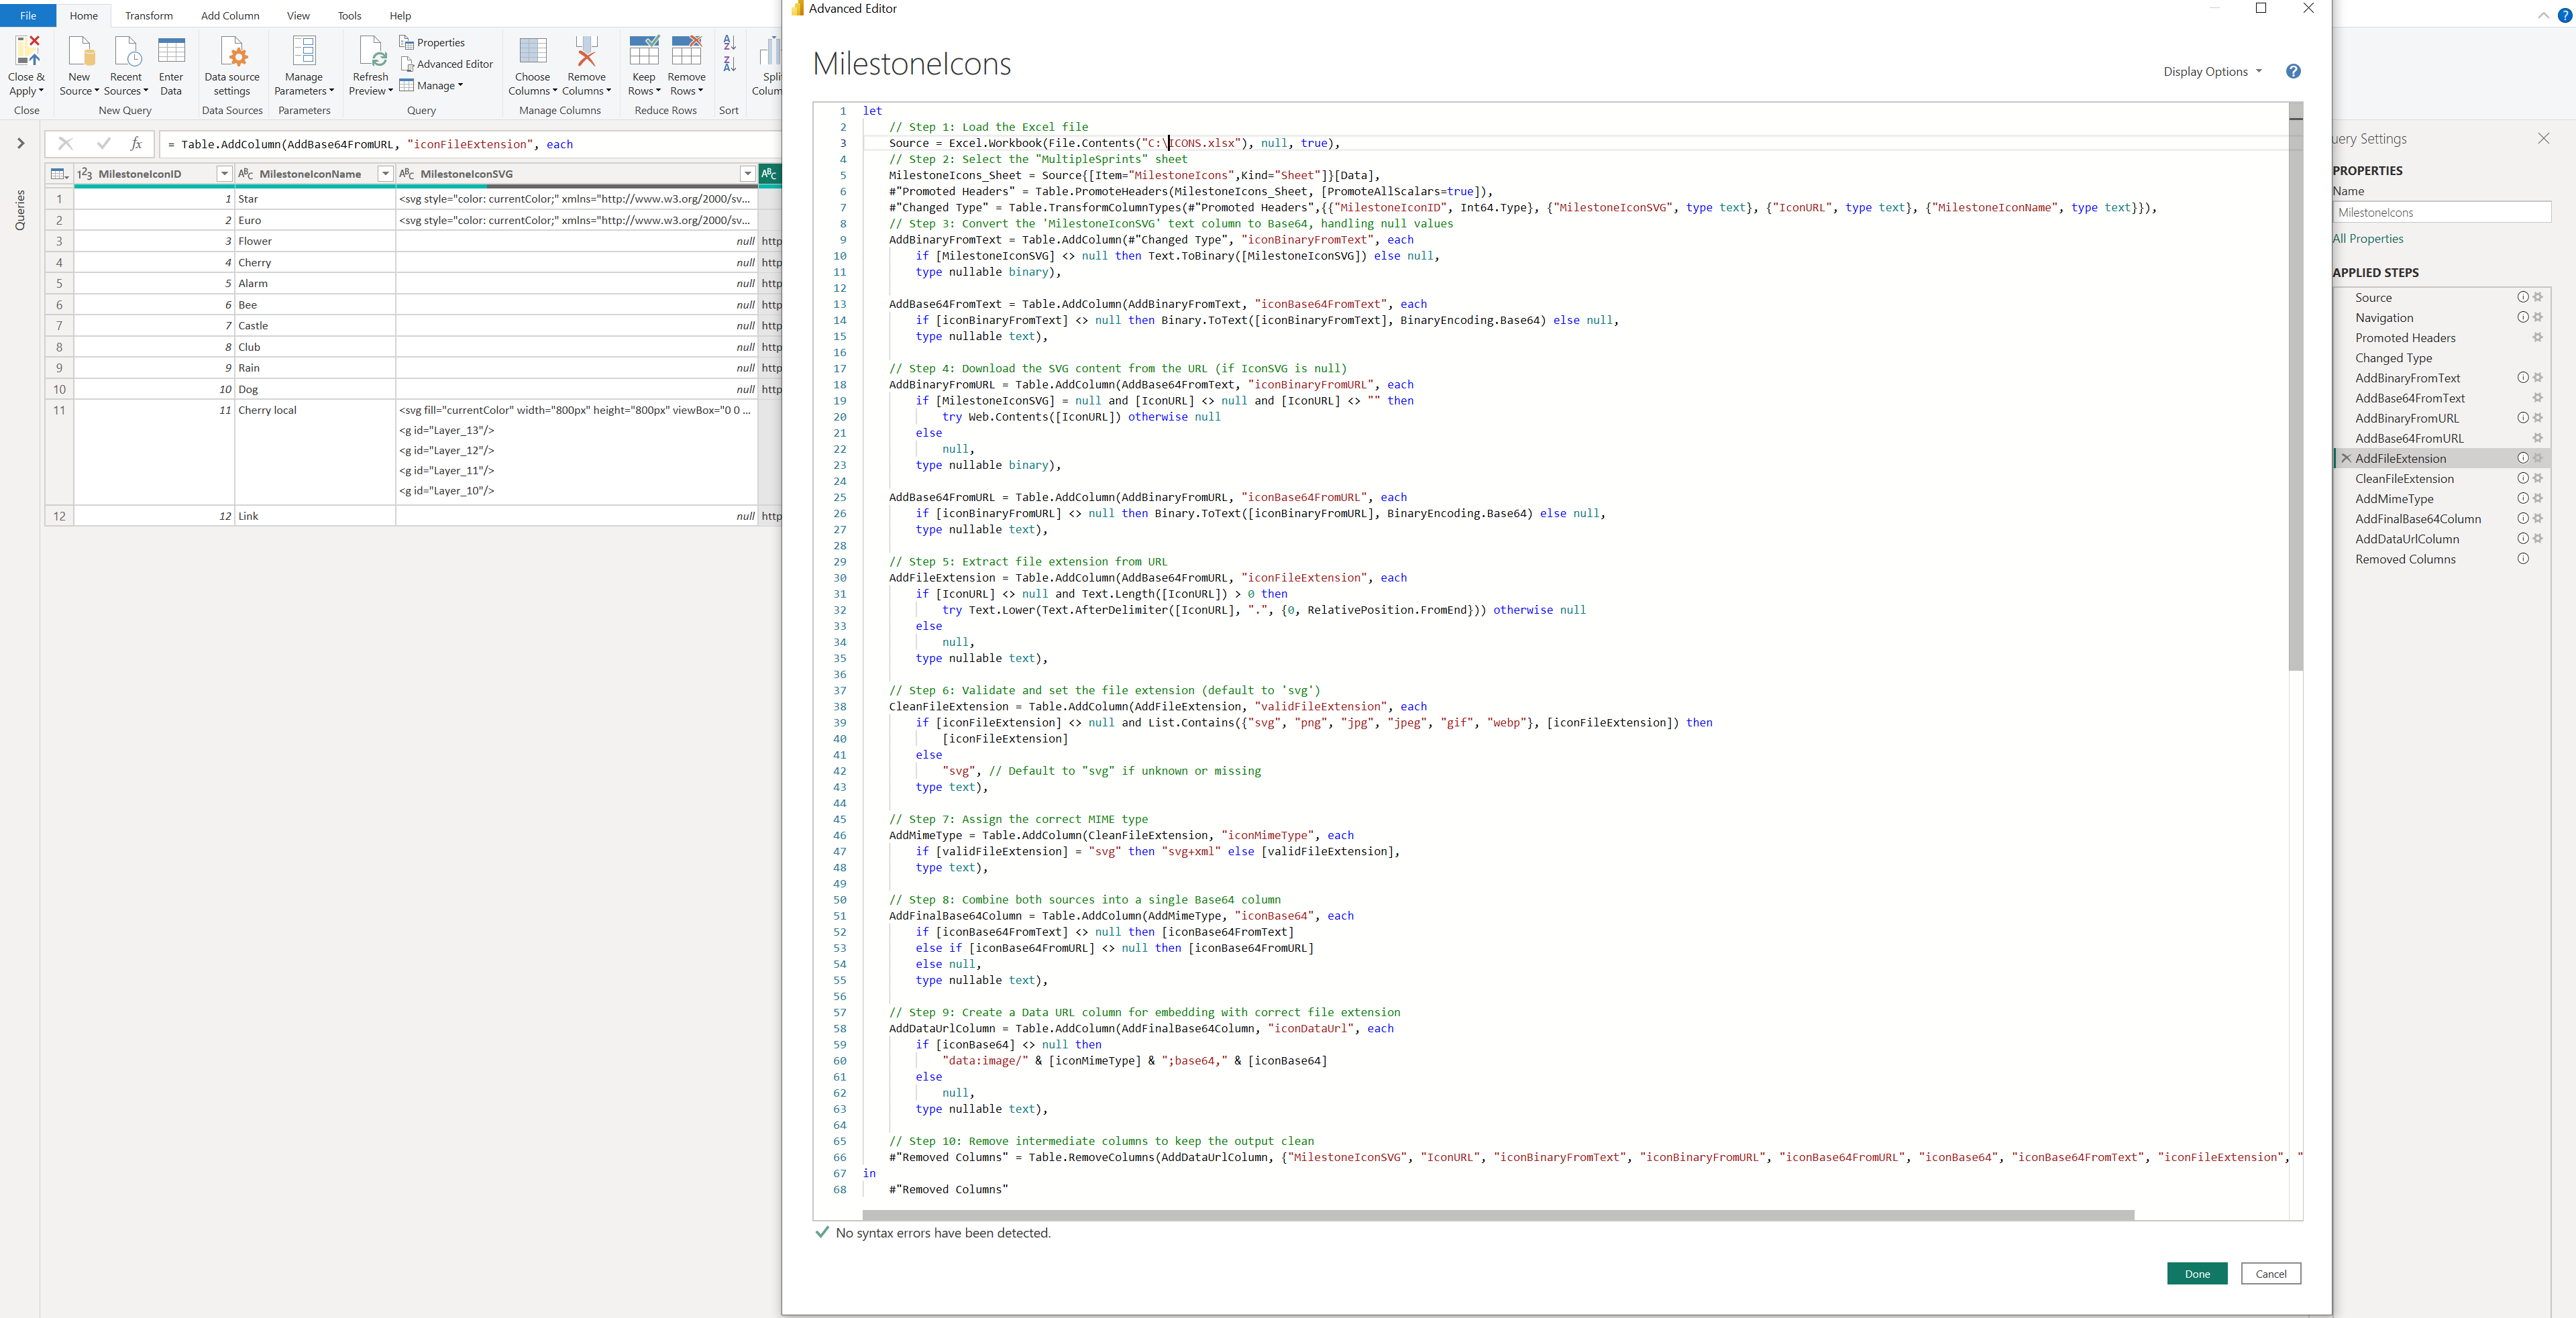

1. Add a Table with the image/icon URLs
- Prepare your icon
- Download or design your own icon. Supported formats: SVG, PNG, JPG and GIF.
- Keep the file small and use a transparent background for best results.
- Tip: For SVGs, you can use
currentColorfor fill and border. This allows icons to dynamically adapt to the chart’s color settings.
- Create the Icons table with the following columns: ID, Name/Category and URL/SVG.
- Convert the Icon to Base64
- Import your Icons (Excel) file into Power Query. You can do the Base64 conversion directly in Power BI by using the
Binary.ToTextfunction with theBinaryEncoding.Base64option in Power Query (click on the screenshot to see the Applied steps).
- Import your Icons (Excel) file into Power Query. You can do the Base64 conversion directly in Power BI by using the
- Set the Data Category.
- In Power BI, change the Data category of the “Base64/URL” column to Image URL.
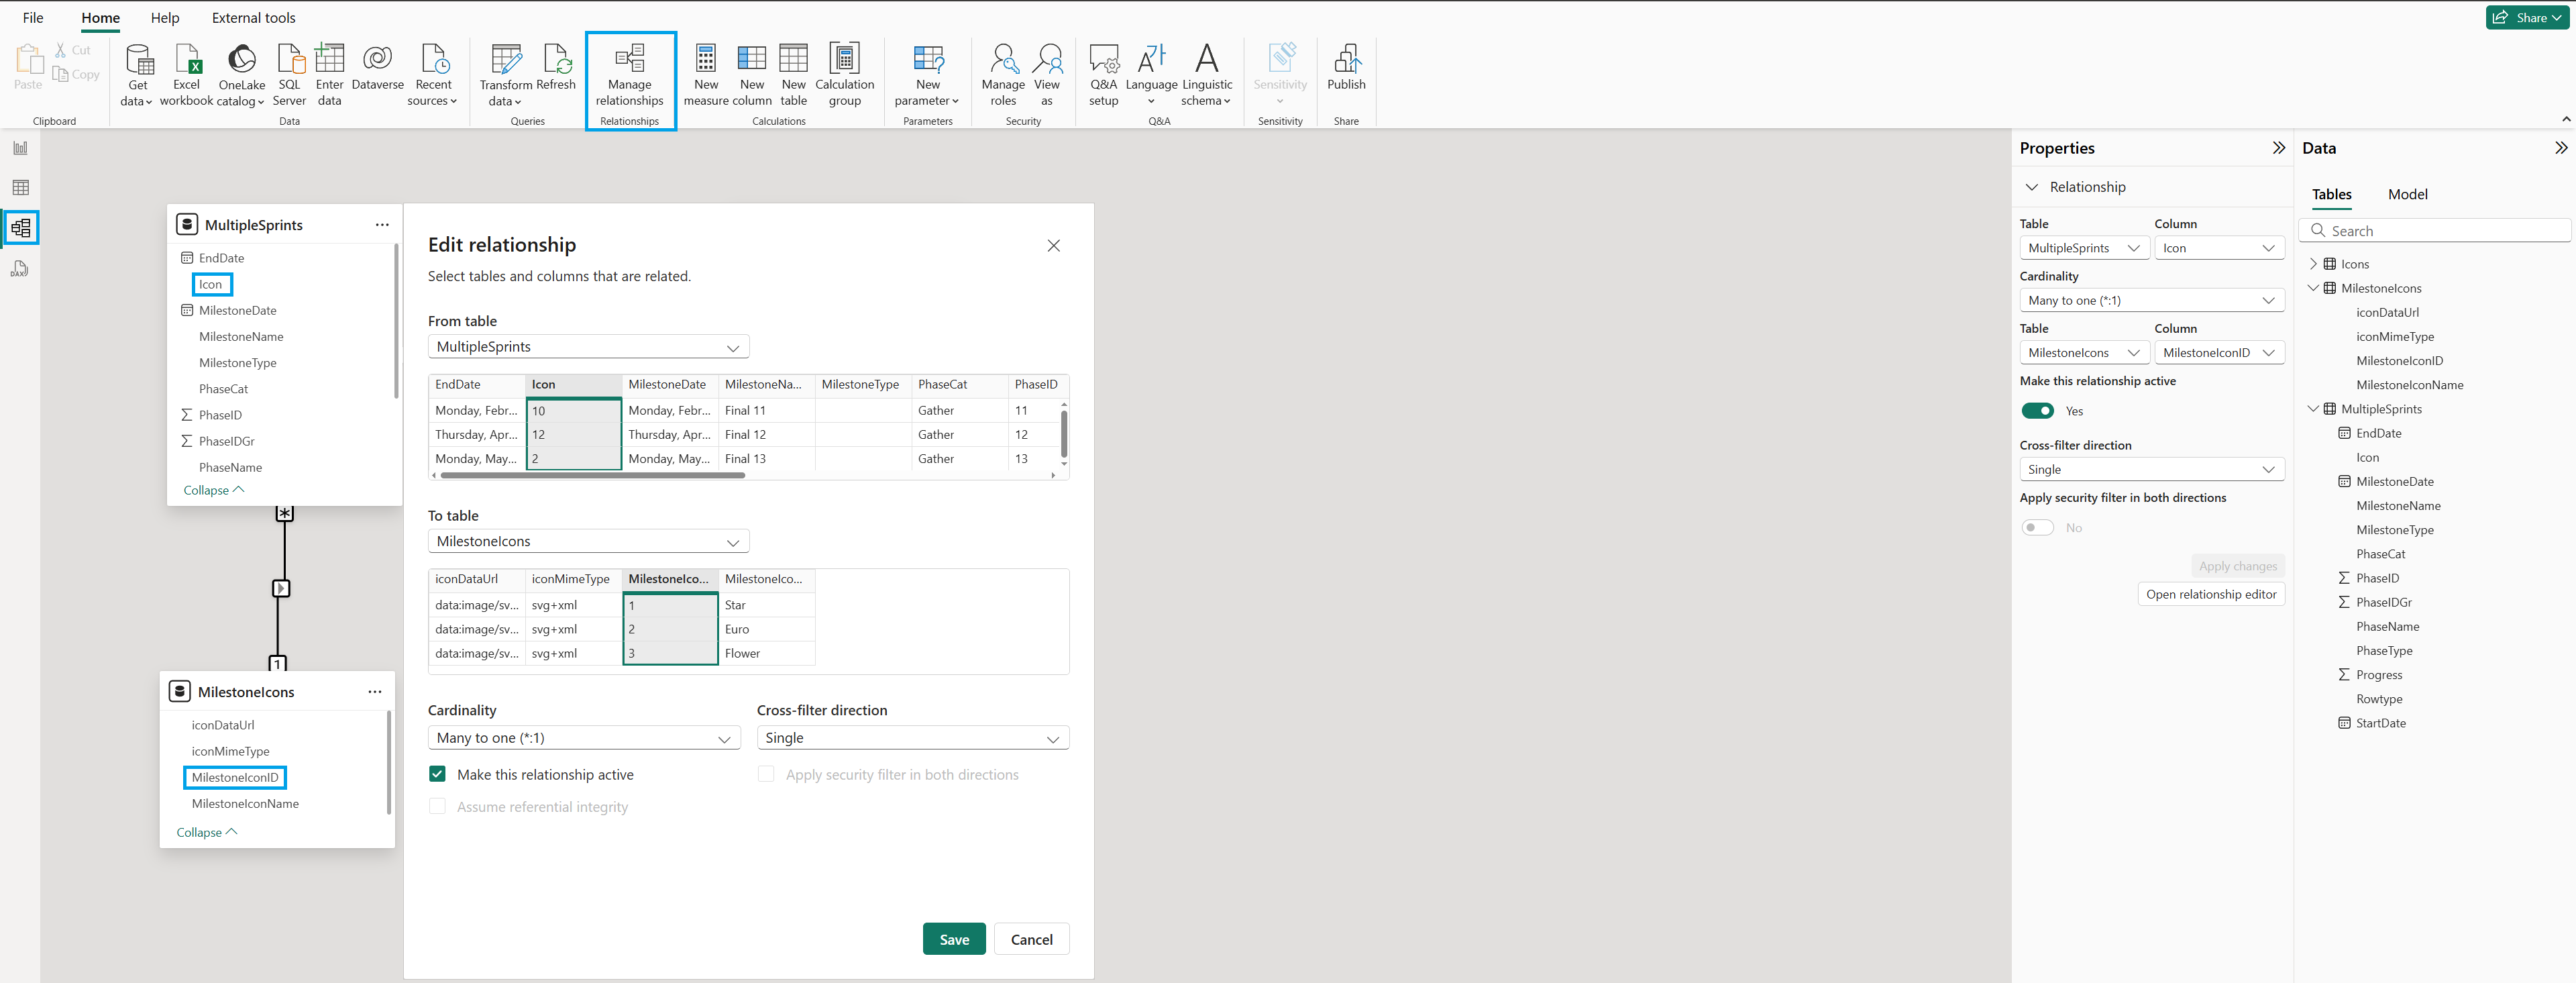
2. Link Tables
Connect the Icons table with your main dataset.
- Click Model view from the left menu.
- Click on the Manage relationships from the top menu.
- Click + New relationship.
- From the first drop-down, select your Dataset table and click the column with the Icon IDs.
- From the next drop-down, select the “Icons” table you just added and select the column with the MilestoneIcon IDs. This ensures the right icon is pulled in dynamically for each row.
- Leave the defaults: Cardinality = Many to one (*:1), Cross filter direction = Single.
- Click OK, then Close.
Your “Icons” table is now linked to your dataset.
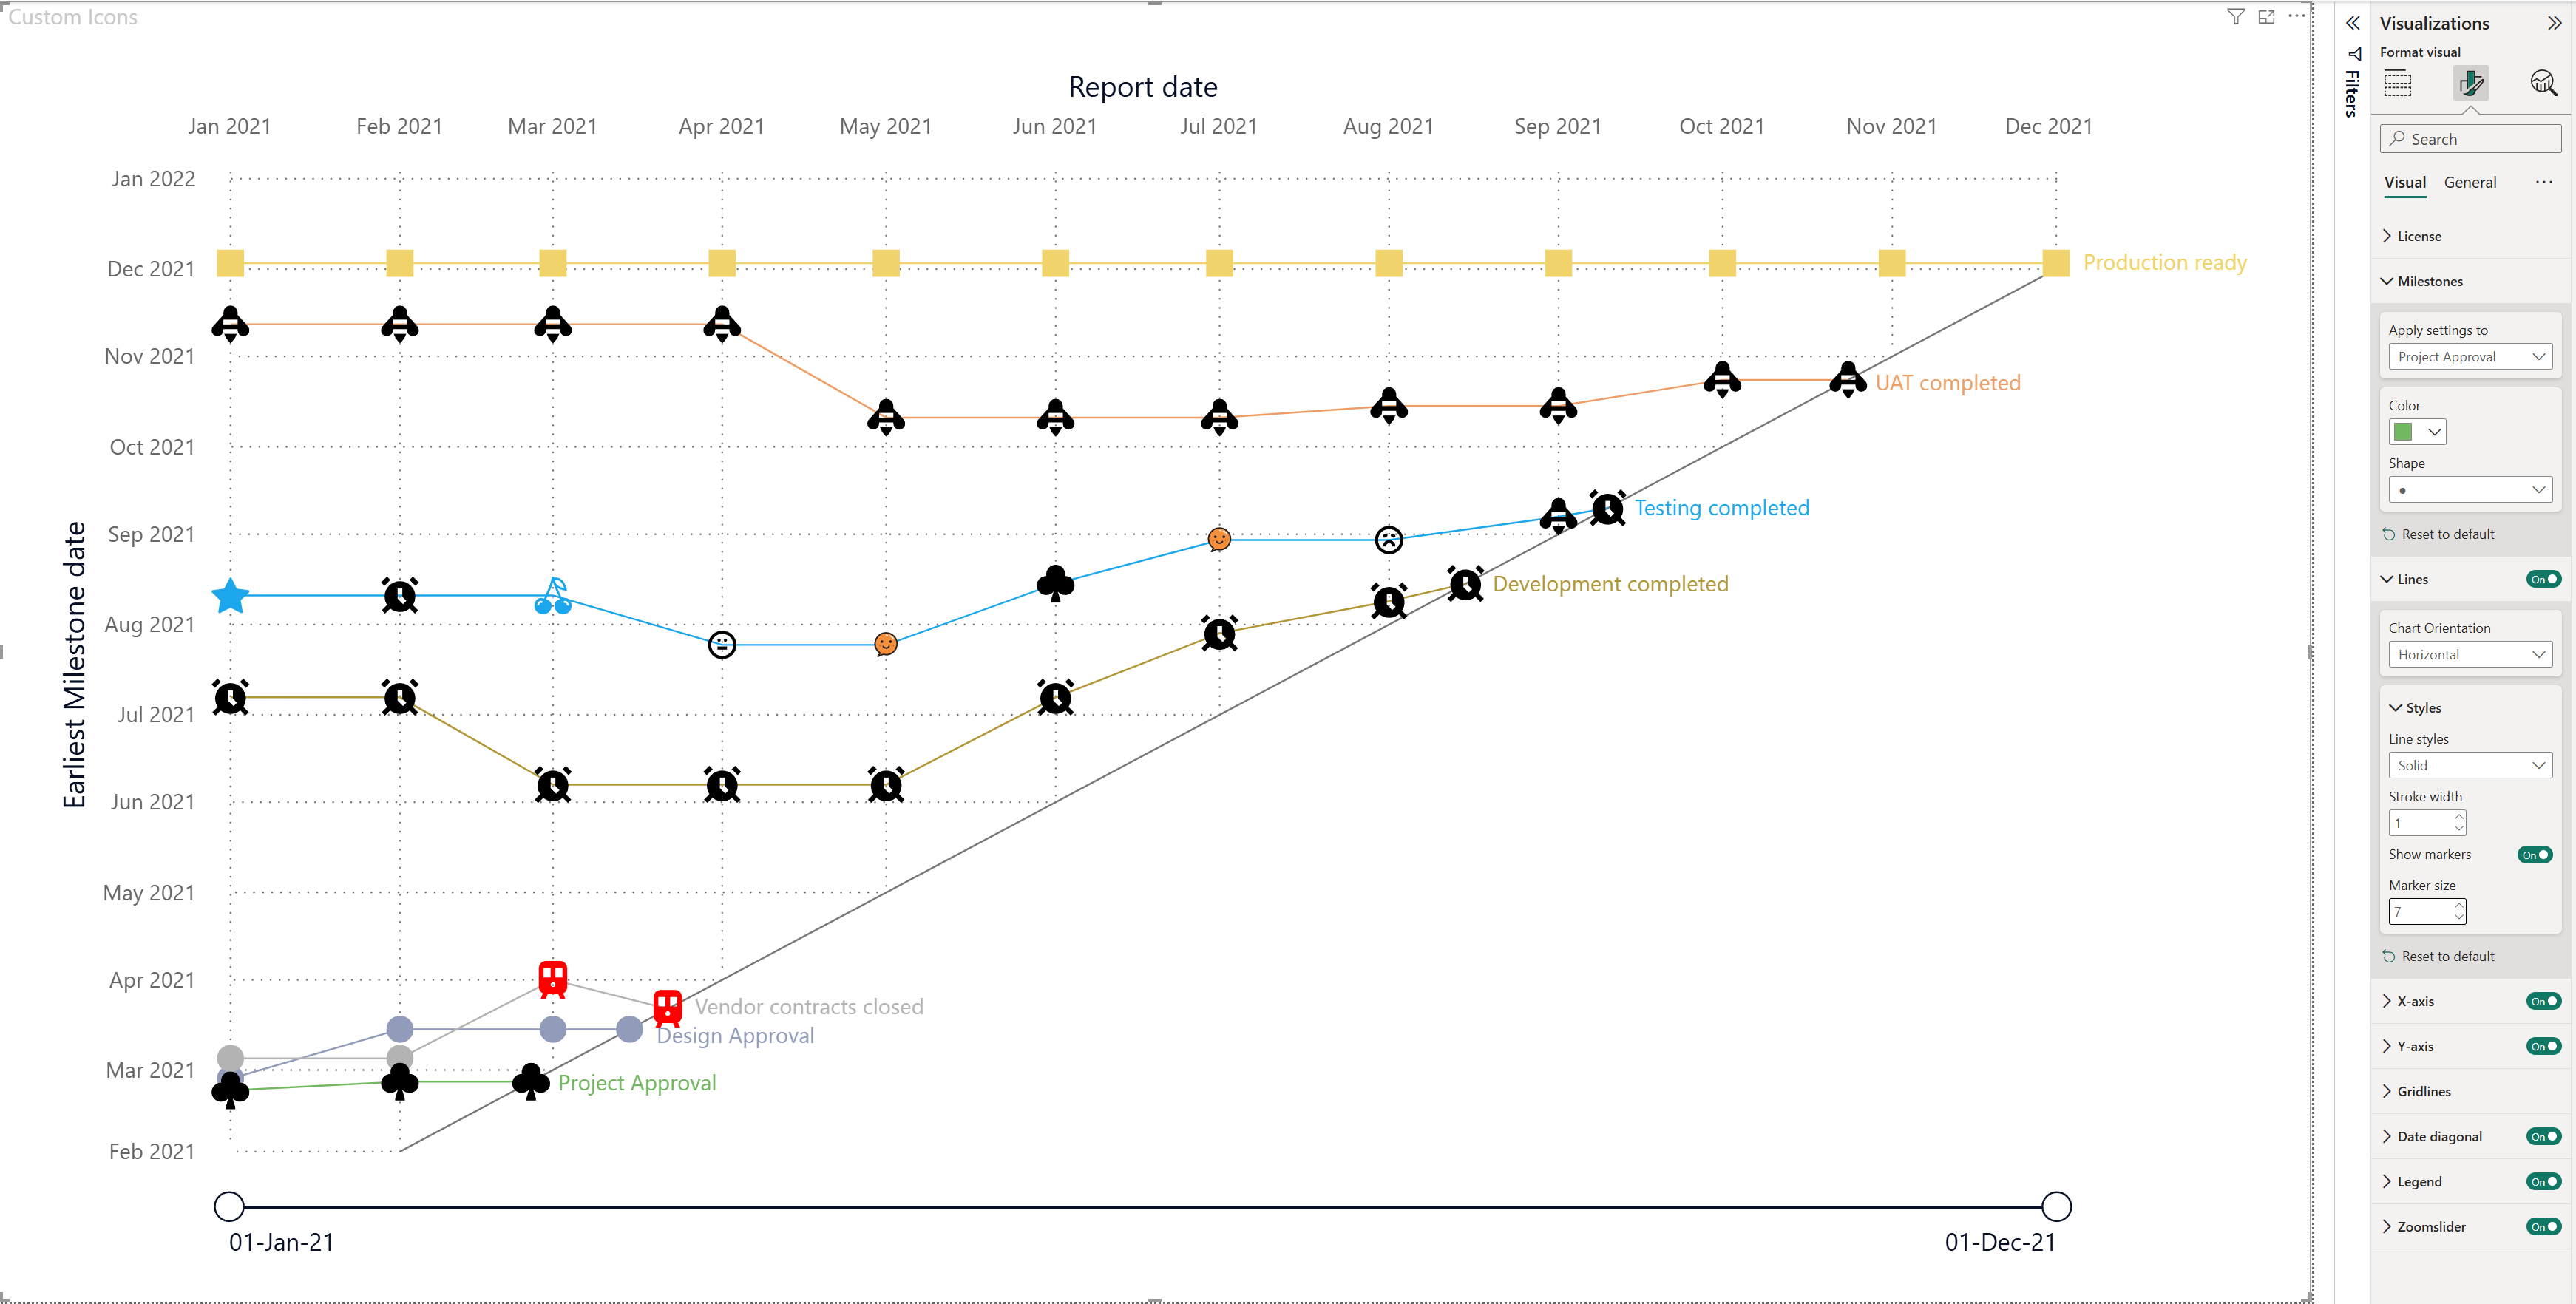
3. Build & Format visual
Add a Milestone Trend Analysis chart to your report and map the “URL” category from the “Icons” table to the Milestone icon well.
- In Power BI, open or locate the report with the Milestone Trend Analysis chart.
- Add at least the following categories: Milestone, Milestone Date, Reporting Date.
- Add the “URL” category into the Milestone icon well.
- Open the Format visual pane and expand the Milestones and/or Lines cards to customize the visual to your preferences.
- For SVGs using
currentColorfor fill and border, icons will automatically adopt the corresponding legend color. Change the Color using the Apply settings to dropdown, and adjust the icon size under Lines > Marker size. - Save your Power BI report and publish it to the Power BI service.
Convert using an external tool
Use this method if you prefer a quick conversion outside of Power BI.
- Prepare your icon. Download or design your icon (supported formats: SVG, PNG, JPG, and GIF). Keep the file small and use a transparent background for best results. For SVGs, you can use
currentColorfor fill and border to allow icons to dynamically adapt to the chart’s color settings. - Convert your icon to Base64 using an online tool (search for “Base64 image encoder”). Copy the generated Base64 string and paste it into the URL/SVG column of your dataset.
- Set the Data Category. In Power BI, change the Data category of the URL/SVG column to Image URL.
- Build and format the visual. Follow the same steps as 3. Build and format the visual.
Considerations
If your images appear cropped or only partially displayed when using Base64 URLs, it’s likely due to Power BI’s character limit for text fields. The Power Query engine supports a maximum of 32,766 characters per text cell. Any text exceeding this limit will be truncated, resulting in incomplete image rendering.
To avoid this issue:
– Use SVGs where possible (smaller for icons/logos).
– Reduce the image resolution to minimize file size.
– For images, use compressed JPG format rather than PNG, since JPG files are smaller.
– Compress images to approximately 20–25 KB to stay within the Power BI character limit.