Tutorial: Adding Custom Icons
You can now add any icon to your PowerGantt visual to represent milestones—bringing even more clarity and customization to your project timelines. Whether you’re highlighting key deliverables, risks, or approval points, custom icons make it easier to tell your story briefly.
These icons also support conditional formatting, enabling dynamic styling based on status, category, or any field in your data. For example, you can automatically display a red warning icon for delayed tasks or a green checkmark for completed milestones.
Custom icons give you the flexibility to match your visual to your organization’s language and branding, making project tracking more intuitive and visually engaging than ever before.
1. Add a Table with the image/icon URLs
- Prepare your icon.
- Download or design your own icon (supported formats include: SVG, PNG, JPG and GIF).
- Make sure the image is small in size and has a transparent background for best results.
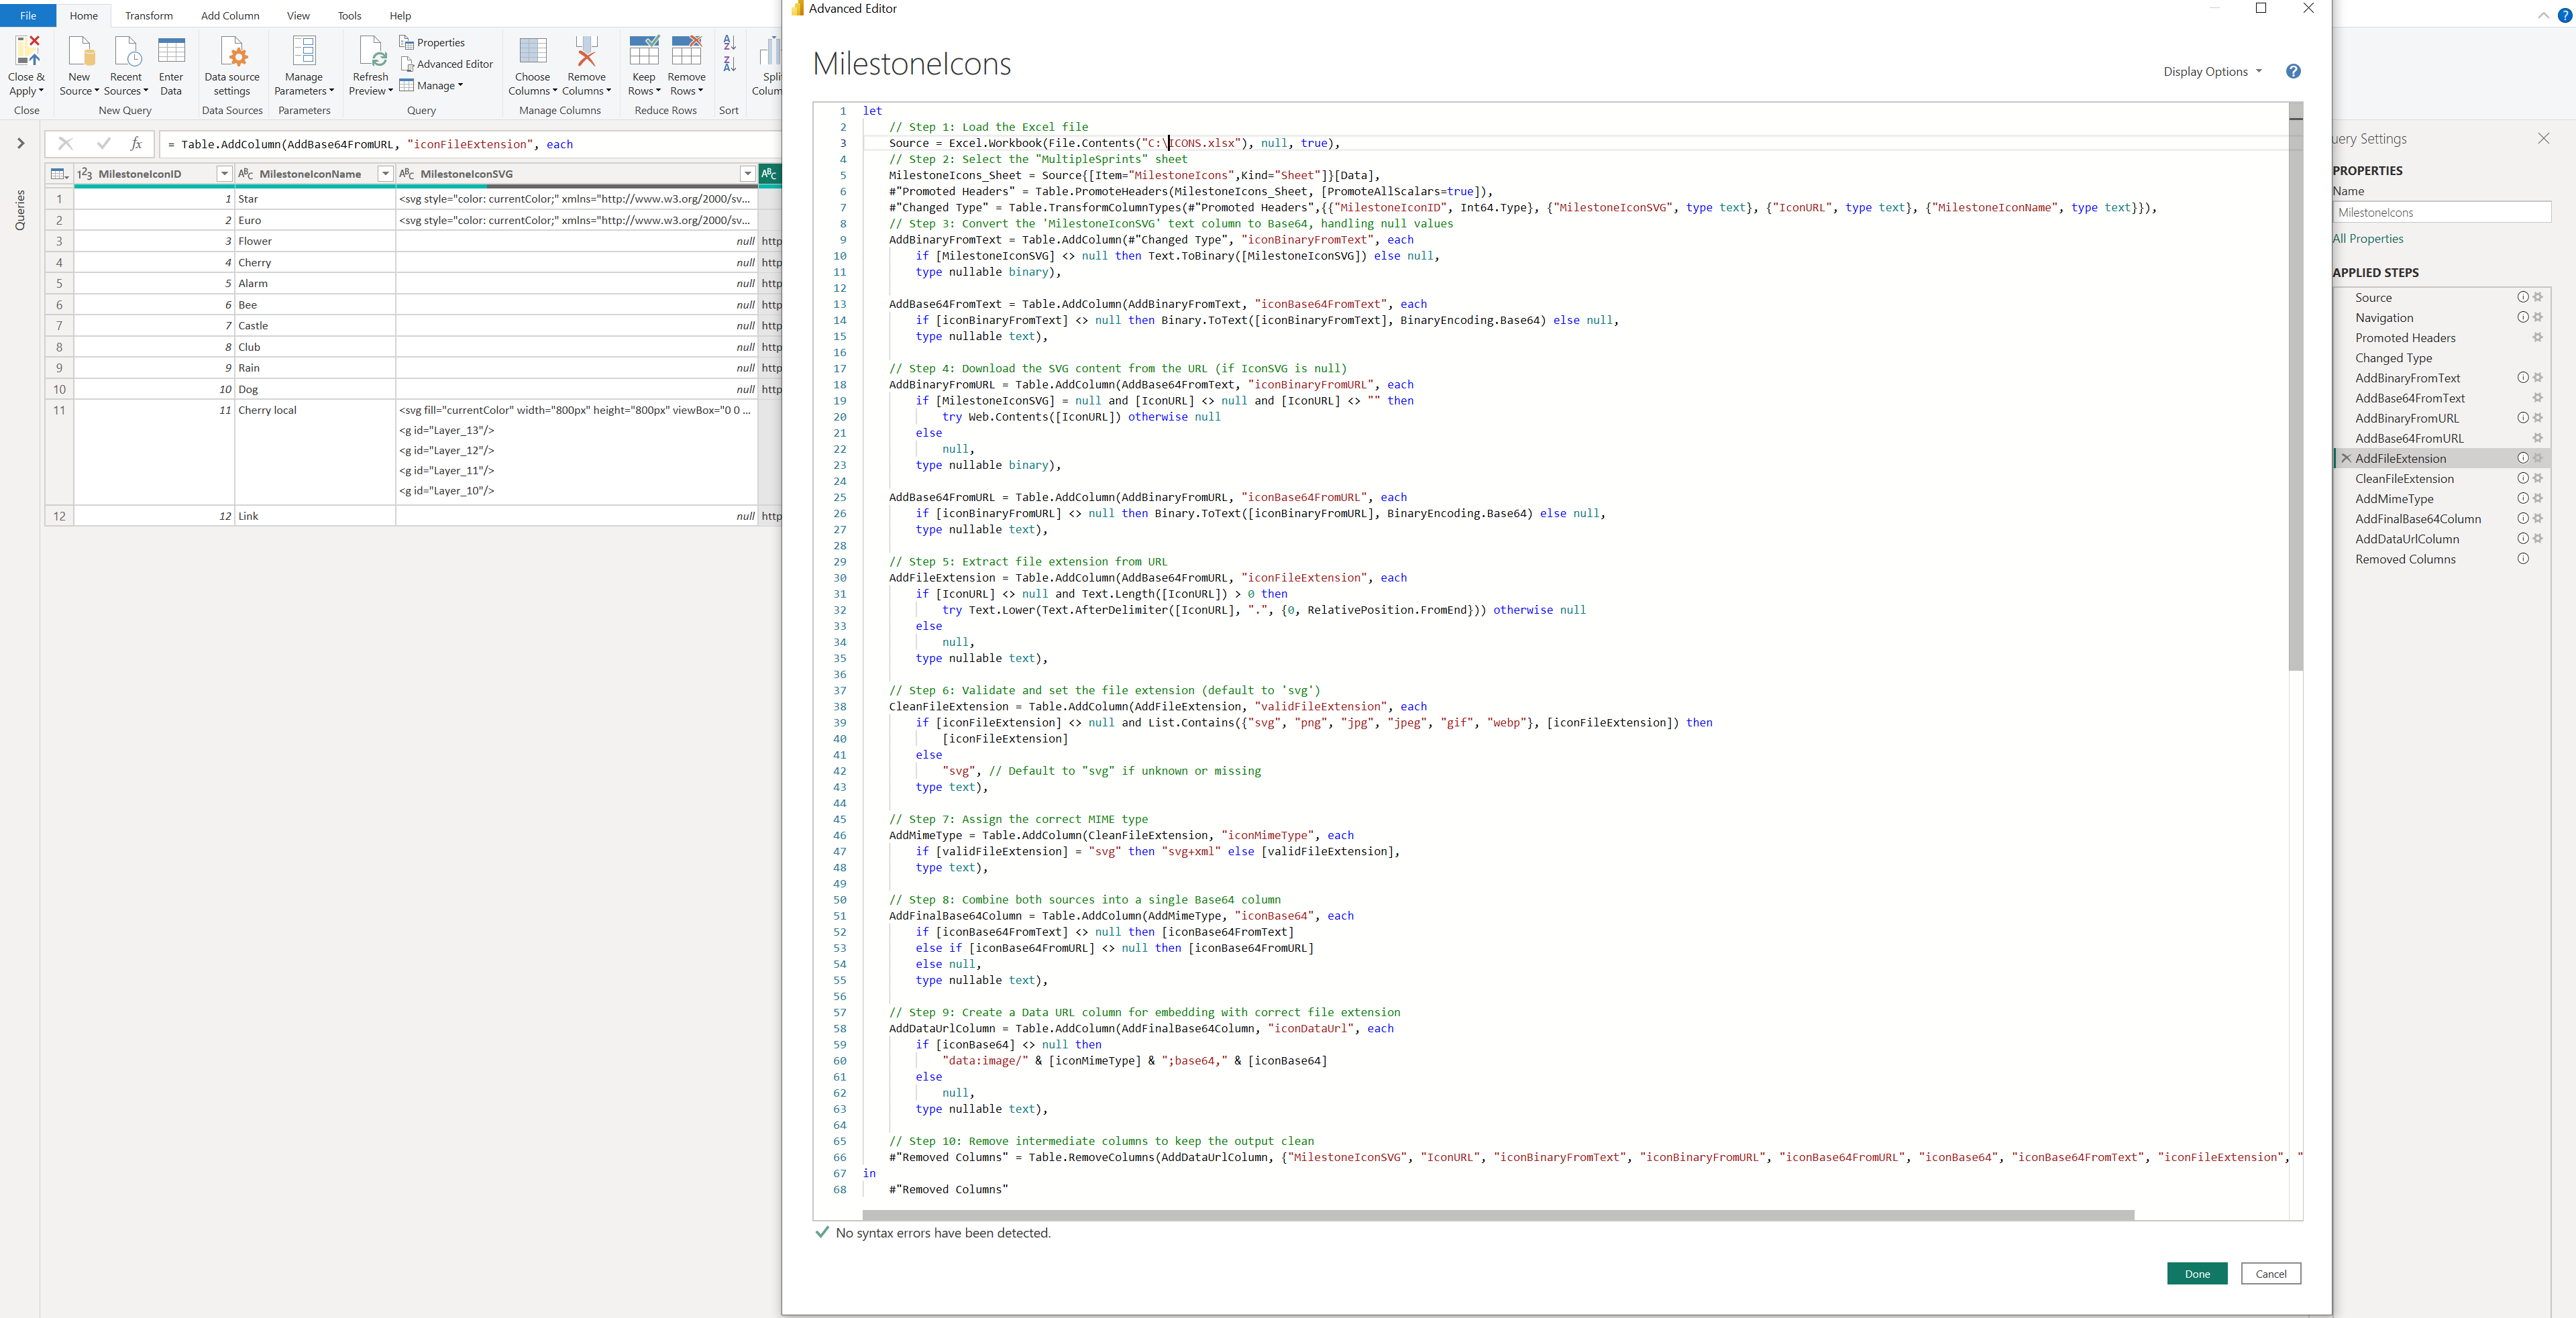
- Convert the Icon to Base64. Icons need to be provided as Base64-encoded images, including the necessary Meta-Data header. For SVGs, you can use
currentColorfor fill and border. This allows icons to dynamically adapt to the chart color settings.- Import the icon file into Power Query. You can do the Base64 conversion directly in Power BI by using the
Binary.ToTextfunction with theBinaryEncoding.Base64option in Power Query. - or use external tools (search for “Base64 image encoder”) to convert your icons or images into Base64 strings. Copy the generated Base64 string.
- Import the icon file into Power Query. You can do the Base64 conversion directly in Power BI by using the
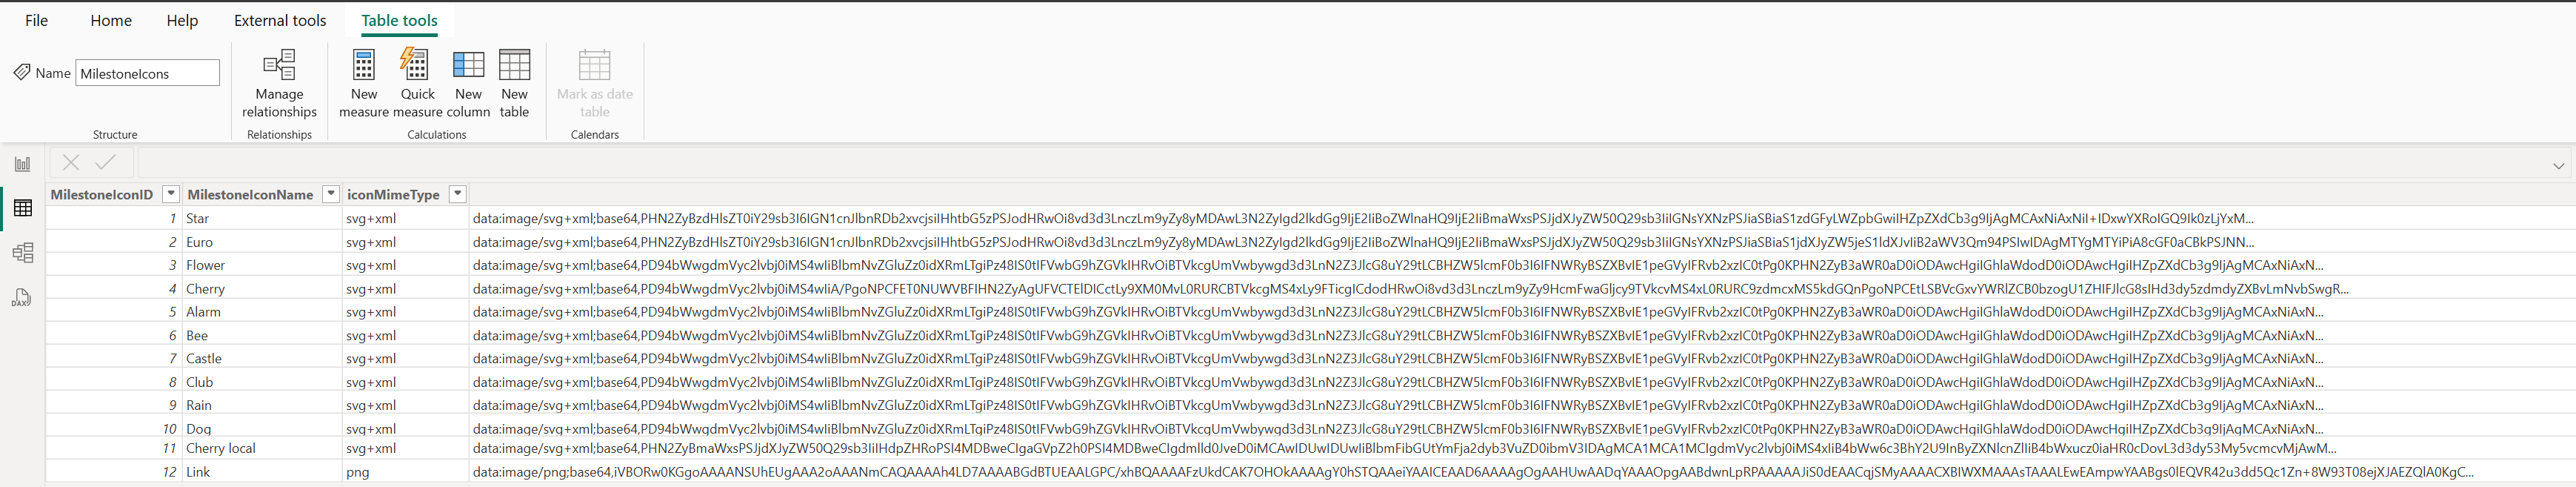
- Create a separate “Icons” Table with an ID, a Name/ Category and a URL or SVG string (Base64 code) column.
- Insert Base64 icons into the table.
- If using Power Query: the conversion is already inside the table (see Applied steps in screenshot).
- If using external tools: paste the copied Base64 strings into the appropriate column.
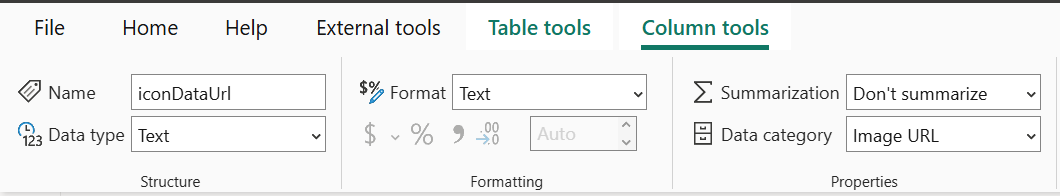
- Set the Data Category.
- In Power BI, change the Data category of the “Base64/URL” column to Image URL to display the image.
2. Link Tables
Connect the “Icons” table with your existing dataset.
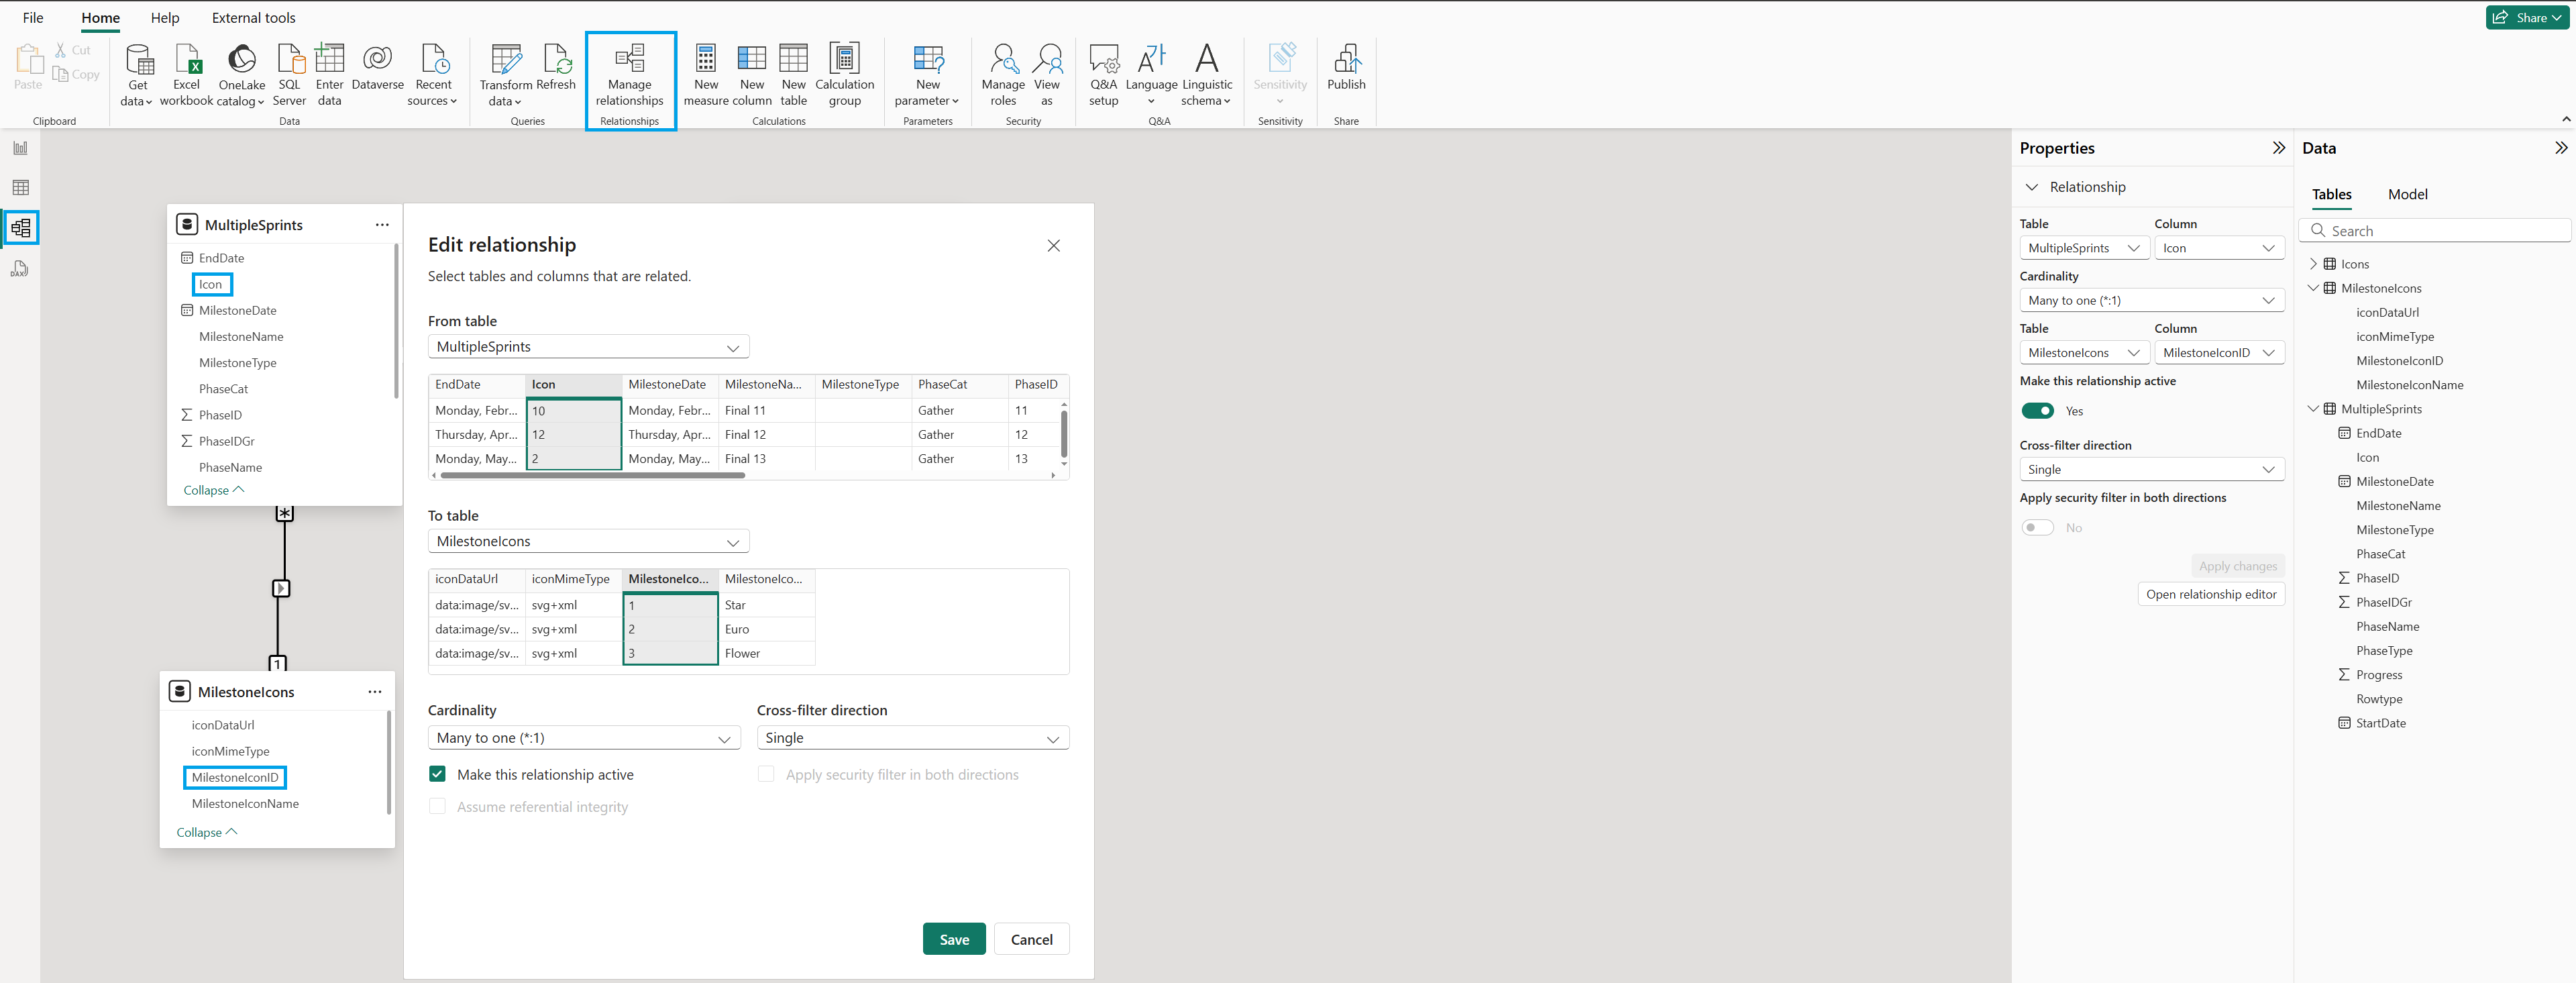
- Click Model view from the left menu.
- Click on the Manage relationships from the top menu.
- Click + New relationship.
- From the first drop-down, select your Dataset table and click the column with Icon IDs.
- On the next drop-down, select the “Icons” table you just added and select the column with the MilestoneIcon IDs. This ensures the right icon is pulled in dynamically for each row.
- By default Cardinality is set to Many to one (*:1).
- By default the Cross filter direction is Single.
- Press OK and Close buttons.
Your “Icons” table is now linked to your dataset.
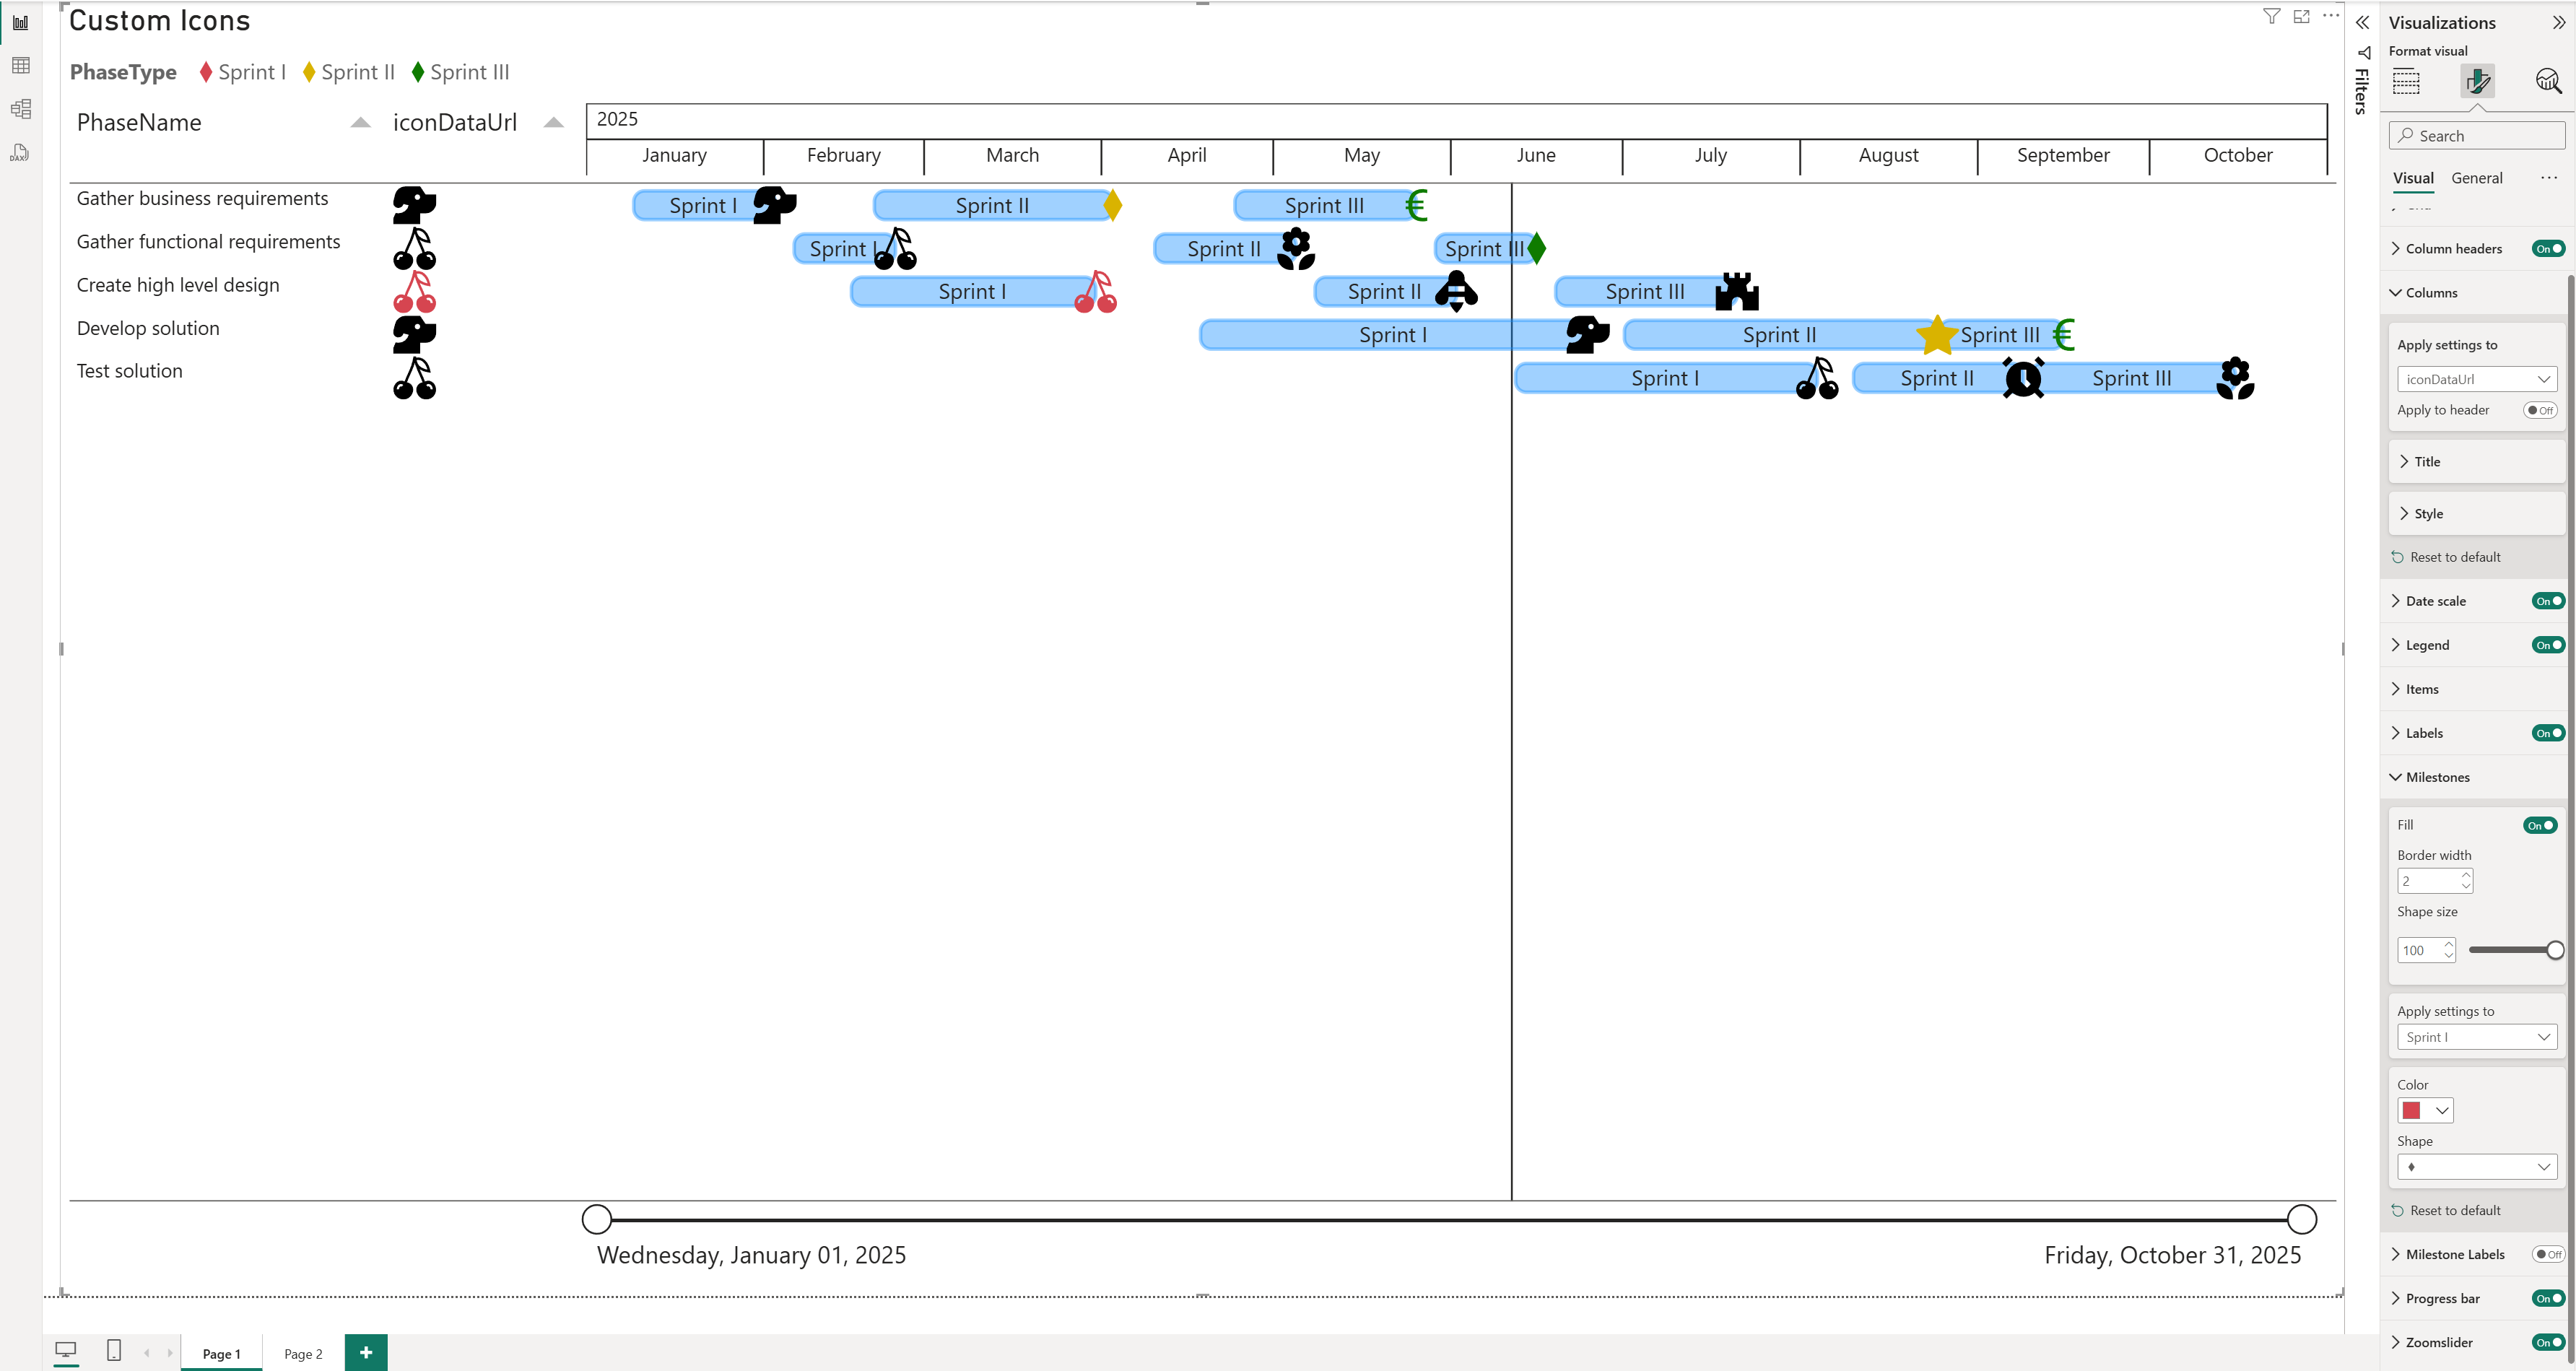
3. Build & Format visual
Add a PowerGantt Chart to your report and add the Icon category to the Milestone icon, Additional columns and/or Item Name wells.
- In Power BI, open or locate the report with the PowerGantt visual.
- Add at least the following categories: Item, Item Name, Start date and End date.
- Add the Icon category to the Milestone icon, Additional columns and/ or Item Name wells.
- Optionally add a category to the Milestone legend.
Take advantage of the additional formatting features available for the Columns and Milestones in the formatting pane and customize it according to your preferences.
Go to Format visual pane and expand the Columns and/ or Milestone cards.
For all SVGs (added to the Item Name or Additional columns), where currentColor was used for fill and border; you can change the color in the Text color option under Columns.
For all SVGs (added to the Milestone icon), where currentColor was used for fill and border; you can change the Shape size and Color under Milestones. If you’ve assigned a category in the Milestone legend, the icons will automatically adopt the corresponding legend color. You can override this behavior for individual items by selecting the desired category from the Apply settings to dropdown list.
Save your Power BI report and publish it to the Power BI service.
Considerations
If your images appear cropped or only partially displayed when using Base64 URLs, it’s likely due to Power BI’s character limit for text fields. The Power Query engine allows a maximum of 32,766 characters per text cell. Any text exceeding this limit will be truncated, resulting in incomplete image rendering.
To avoid this issue: Use SVGs where possible (smaller for icons/logos). Reduce the image resolution to minimize file size. For images, use compressed JPG format rather than PNG, since JPG files are smaller. Compress images to around 20–25 KB to stay within the Power BI character limit.