Introduction: Shielded HTML Viewer

Visualise your HTML formatted content to add valuable context to your figures
Most business applications allow users to enrich the data by adding additional context. Often, this additional context (like comments and feedback) is stored as HTML formatted text. This allows the user to not only include the content, but also apply all kinds of formatting to the content (like Bold, Italic, lists, tables, etc.).
Being able to show this additional context adds value to reports and dashboard, as it helps the readers to better understand the presented figures.
The Shielded HTML Viewer will seamlessly display any HTML-5 formatted text next to other figures in your Power BI reports.
The Shielded HTML Viewer will only process and render HTML-tags and -attributes that are specified in our allow-list. This to mitigate potential security risks (such as inline scripting). Any tag or attribute not specified on the allow-list will be ignored.
The basic functionality of the Shielded HTML Viewer is available for free and will display the HTML formatted text. The licensed version contains additional features like changing the default font, default text-color and switching between single row and multi-row display. Interested in trying the licensed features? Just turn on the Paid Features option and they will be visible.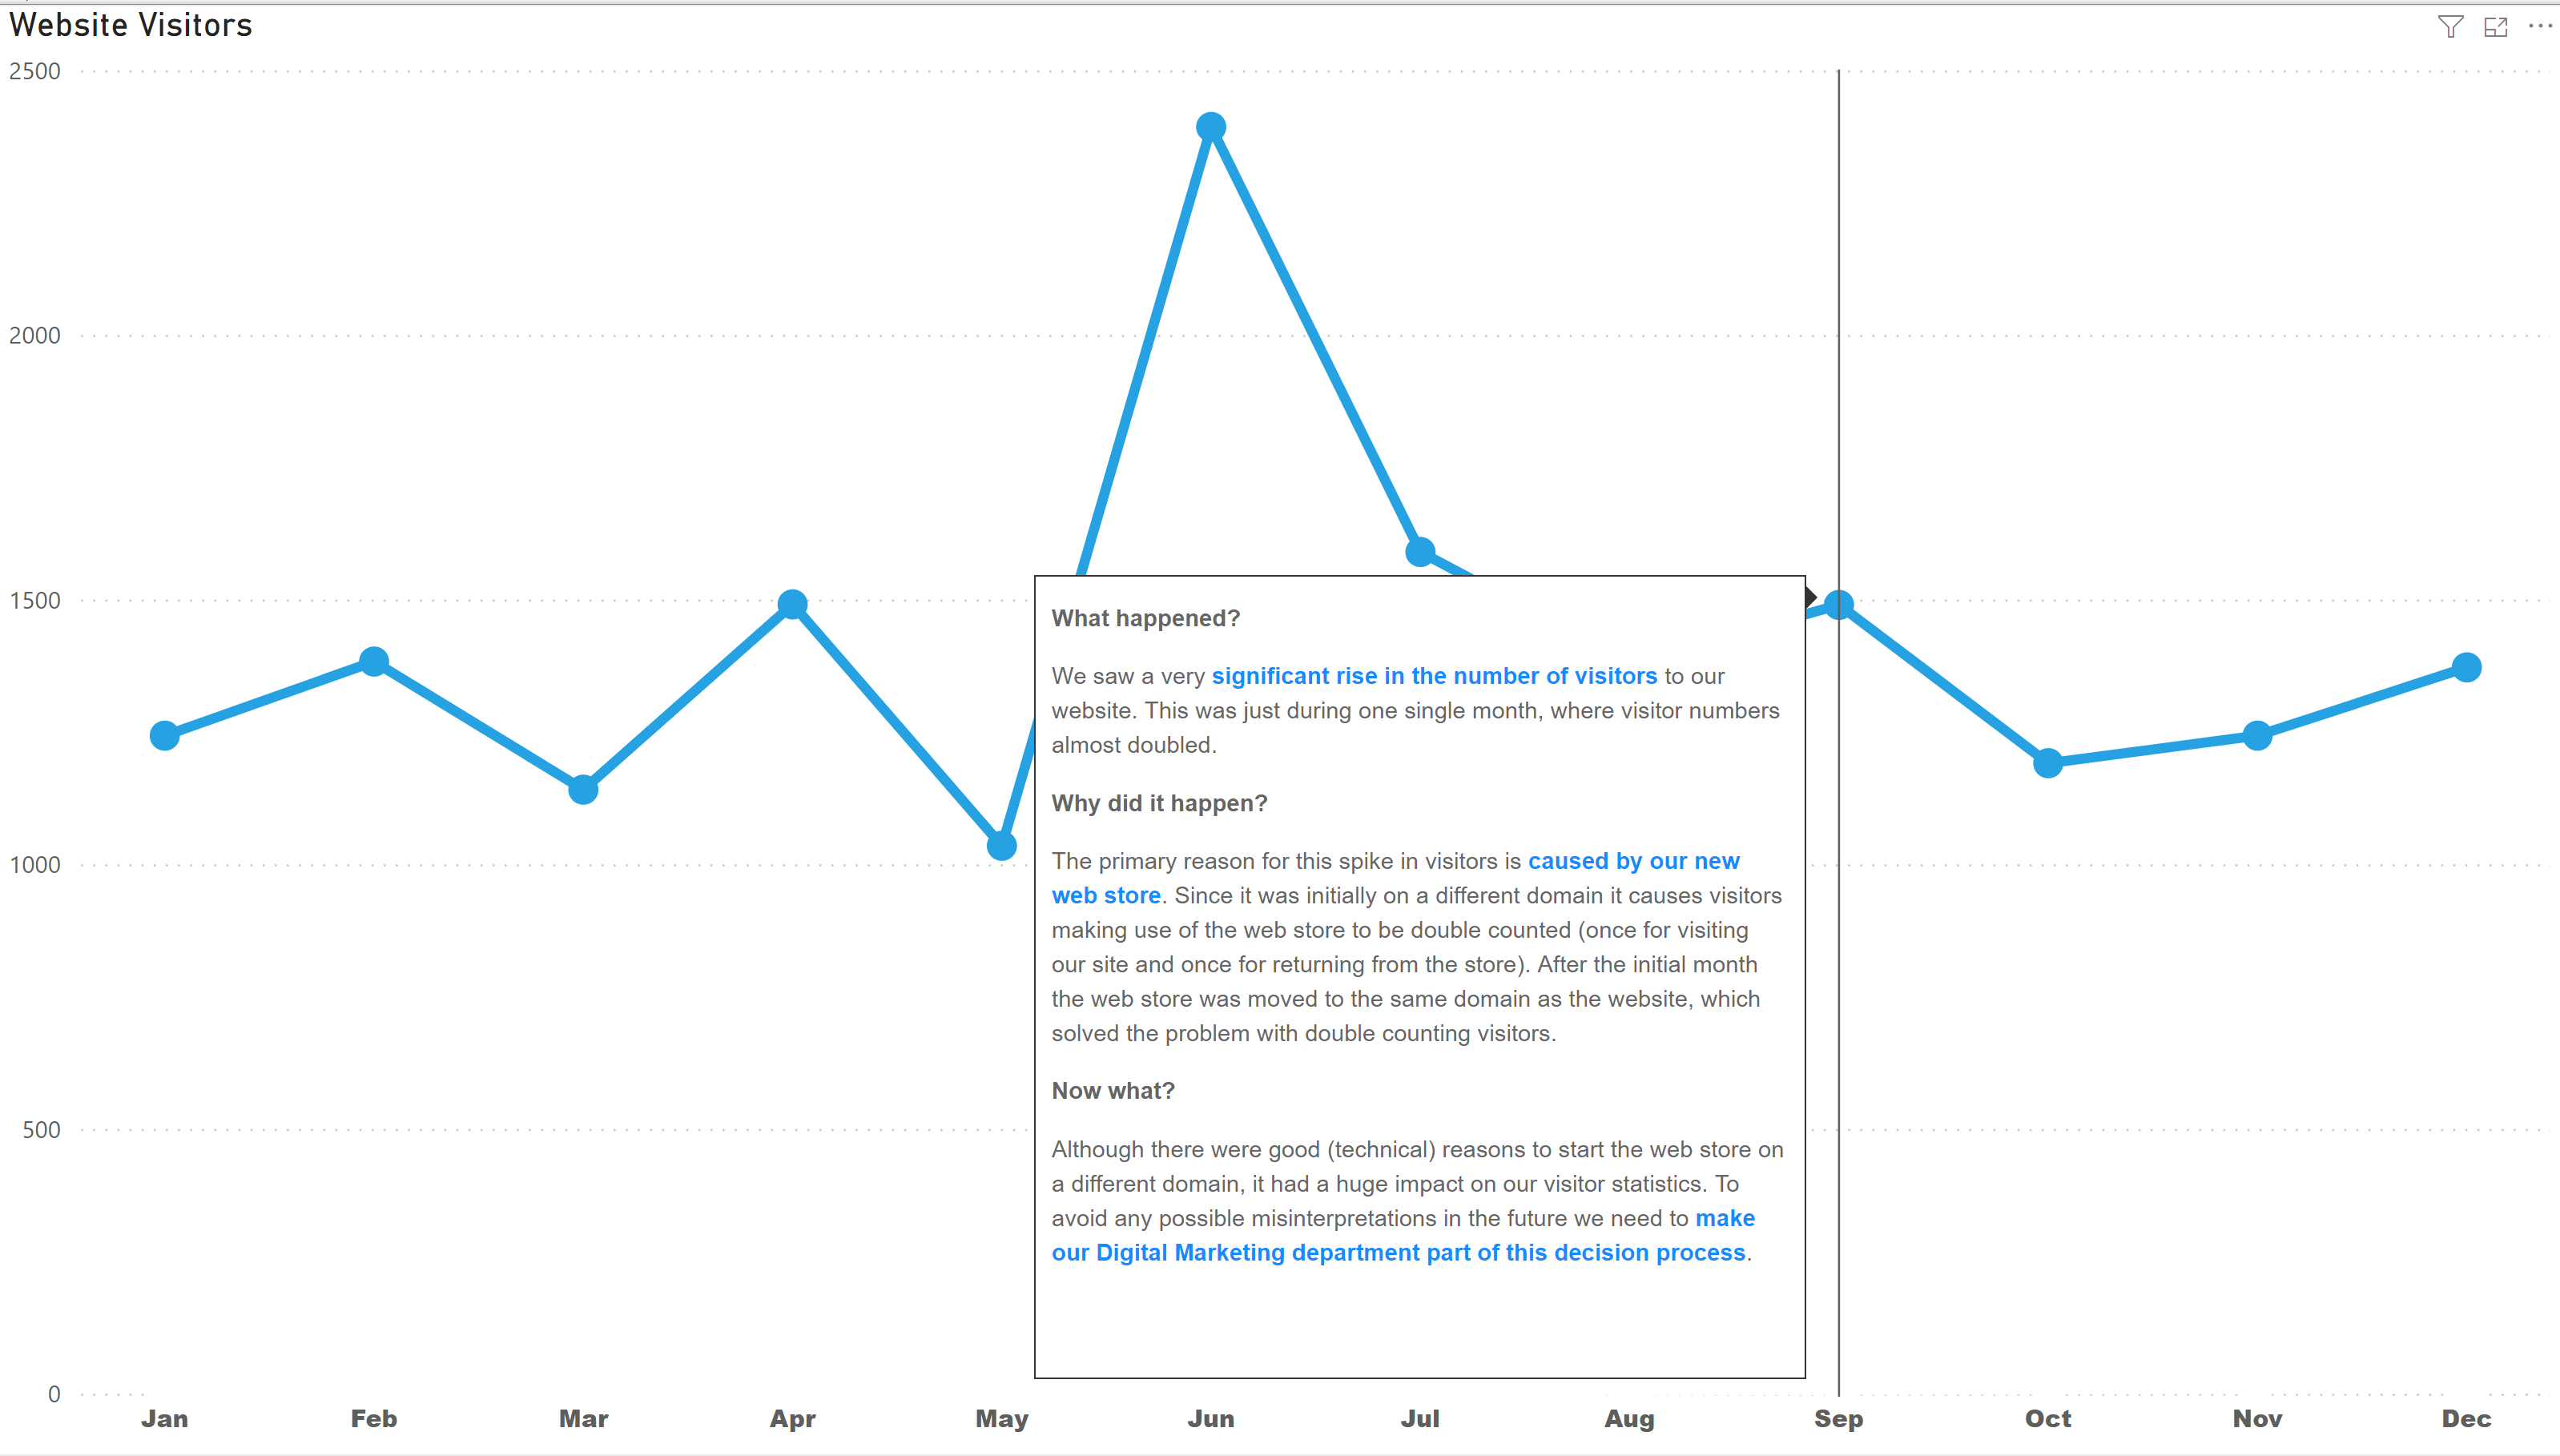
How to use: Build visual
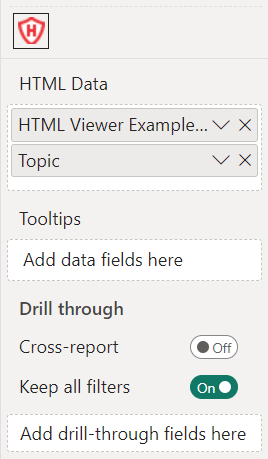
Available fields:
- HTML Data: add here the data-field(s) containing the HTML data you want to display. When you have your HTML-code in multiple columns of your dataset and want to render it in a grid, just drop all your columns that you want to render in the HTML Data field. The Shielded HTML Viewer then renders your HTML in a grid.
- Tooltips: the data-fields added here will show up in the tooltip when the user hovers an item in the visual.
The Shielded HTML Viewer makes use of an allow-list to avoid unexpected results. The allow-list contains the following HTML5-elements:
- Content sectioning: h1, h2, h3, h4, h5, h6
- Text content: blockquote, dd, div, dl, dt, hr, li, ol, p, pre, ul
- Inline text semantics: a, b, br, code, em, i, q, s, small, span, strong, sub, sup, wbr
- Table content: caption, col, colgroup, table, tbody, td, tfoot, th, thead, tr
The Shielded HTML Viewer supports the following tags:
- NAV-tag to add HTML navigation menu’s to your reports. For more information, check the article Add navigation to your report.
- SVG-tags and IMG-tag to add inline SVG and Data URL images.
- clip-path on SVG-elements.
This way you can include any inline images in your Power BI reports and dashboards but without the need of risky external links.
How to use: Format visual
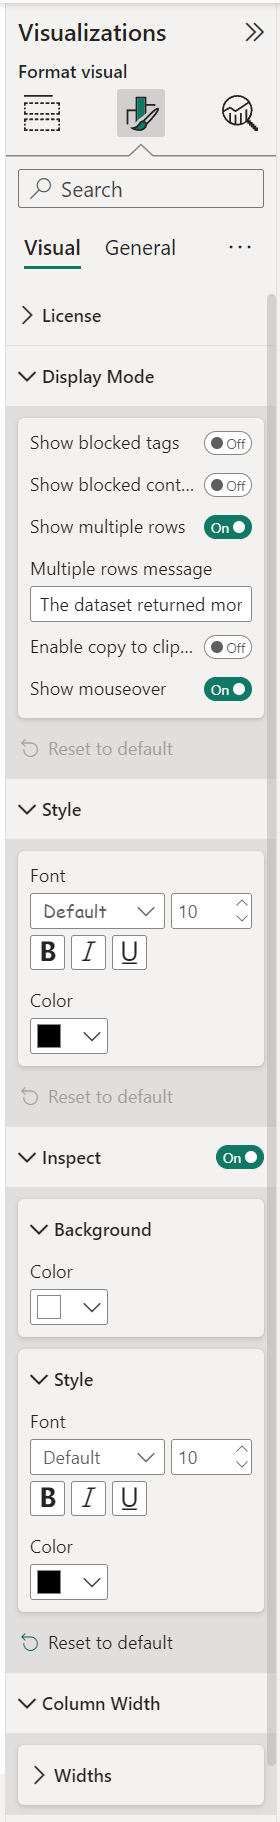
The Visual specific settings contain formatting properties that allow you to change the default behavior of the visual:
- License: here you can enter your PREMIUM license information to disable any license reminders.
- Display Mode: by default the Shielded HTML Viewer will parse all the HTML of the allow-list and show the formatted result. Here you can enable/ disable the Show blocked tags, Show blocked content or Show multiple rows options. You also can Enable copy to clipboard to copy the richt text to the clipboard. Toggle Show mouseover option off to hide hover on items.
- Style: the HTML you supply will probably contain most style options, but here you can change the default behavior for those elements that do not have any specific style options specified. Available options Font family, text Size, emphasized text (Bold, Italic, Underline) and text Color.
- Inspect: by default off, toggle on to view the rendered/ sanitized HTML in the format it was created.
- Background: to change the background Color.
- Style: to change the Font family, text Size, emphasized text (Bold, Italic, Underline) and text Color of the “inspected” text.
- Column width: available if you have more than one data-field in the HTML Data field. Here you can adjust the widths of the columns.
The General settings contain options that affect the visual container and are consistent across all visual types. Here you can also customize the general Properties, Title, Effects, Header icons, Alt text.
For any questions or remarks about this visual, please contact us by email at Nova Silva Support or visit the community forum.