
Years ago, Stacey Barr introduced us to the magic of Control Charts. Magic it is, because it allows everyone to split their temporal data in two: random noise and real signals. And we all are looking for real signals, and don’t want to be distracted by random noise.
In our last release of the Control Chart XmR we have added several new features to make it even easier to find real signals and ignore random noise in your data.
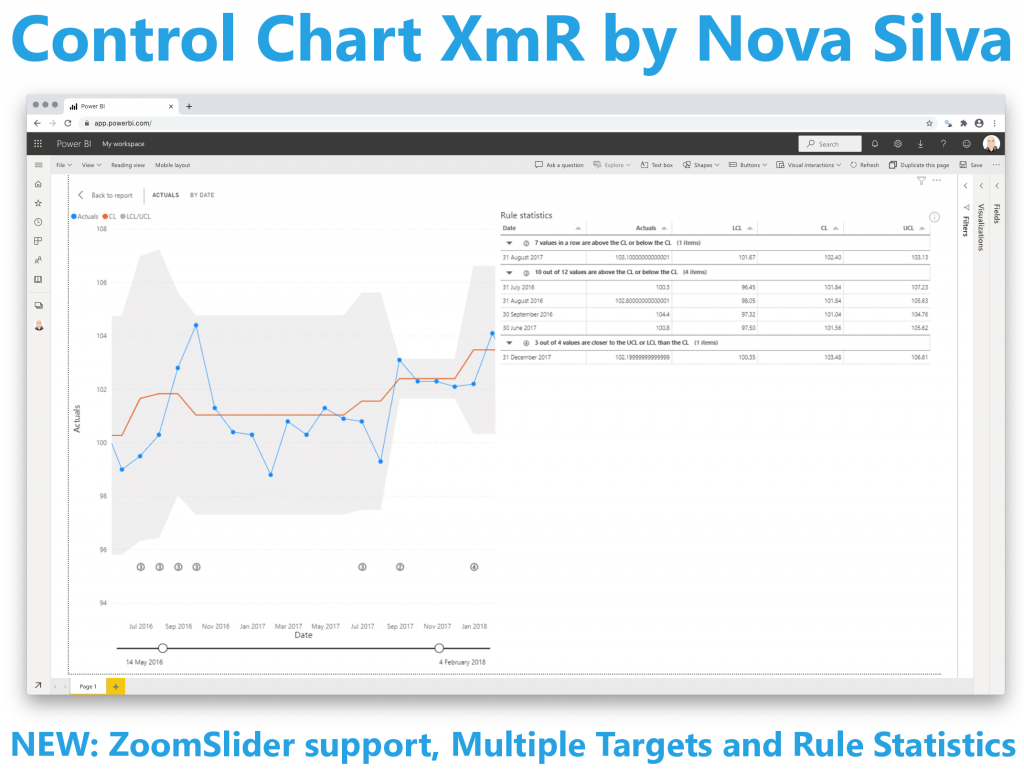
First, we added ZoomSlider support to the Control Chart XmR to make it easier to navigate through time.
We now also allow for multiple targets, so you can define more than just one target.
And finally, you can now review all the signals in a table when you view the Control Chart XmR in “focus mode”.
Don’t hesitate and try the new Control Chart XmR now on your own data by downloading it from the AppSource. All features are available for free to evaluate this visual within Power BI Desktop.