

When you want to visualize your program and project schedules you need a Gantt Chart but you don’t want to be limited in any way. So unlike others:
We developed the only true unlimited Power Gant Chart for Power BI.
- unlimited number of tasks
- unlimited number of activities
- unlimited number of hierarchy levels
- unlimited number of milestones
Review satisfied customers
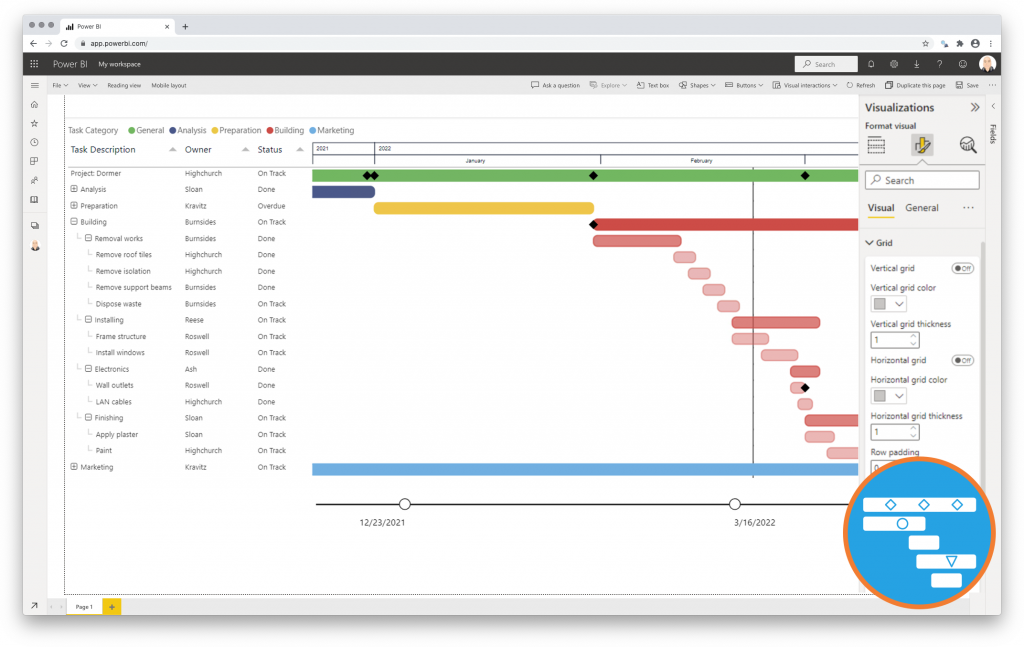
Create powerfull Gantt charts with ease
2 Minute instruction video
Our unique features and benefits
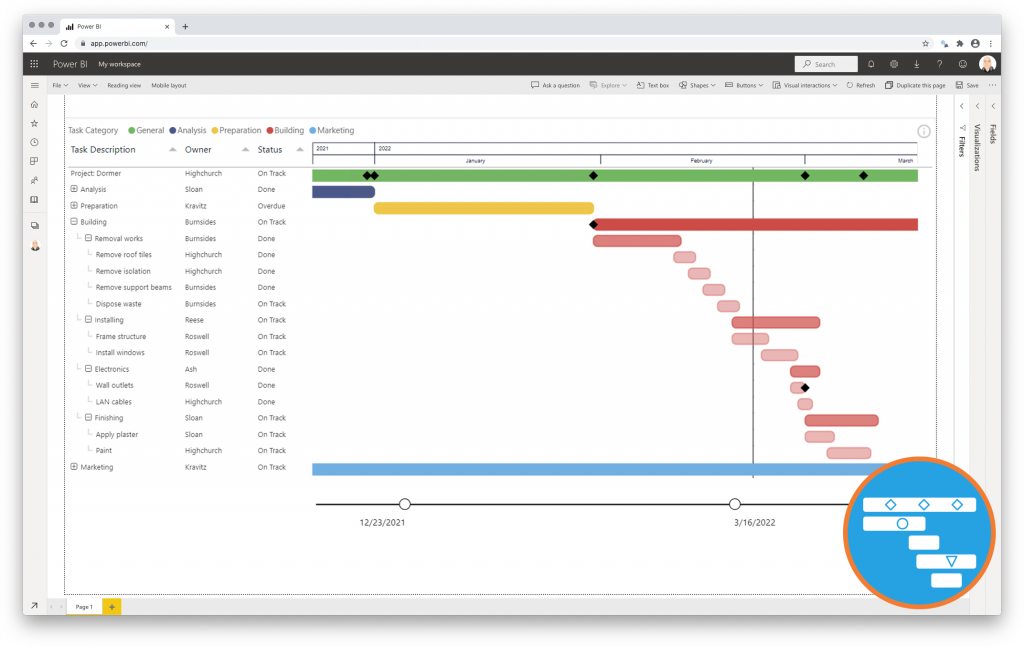
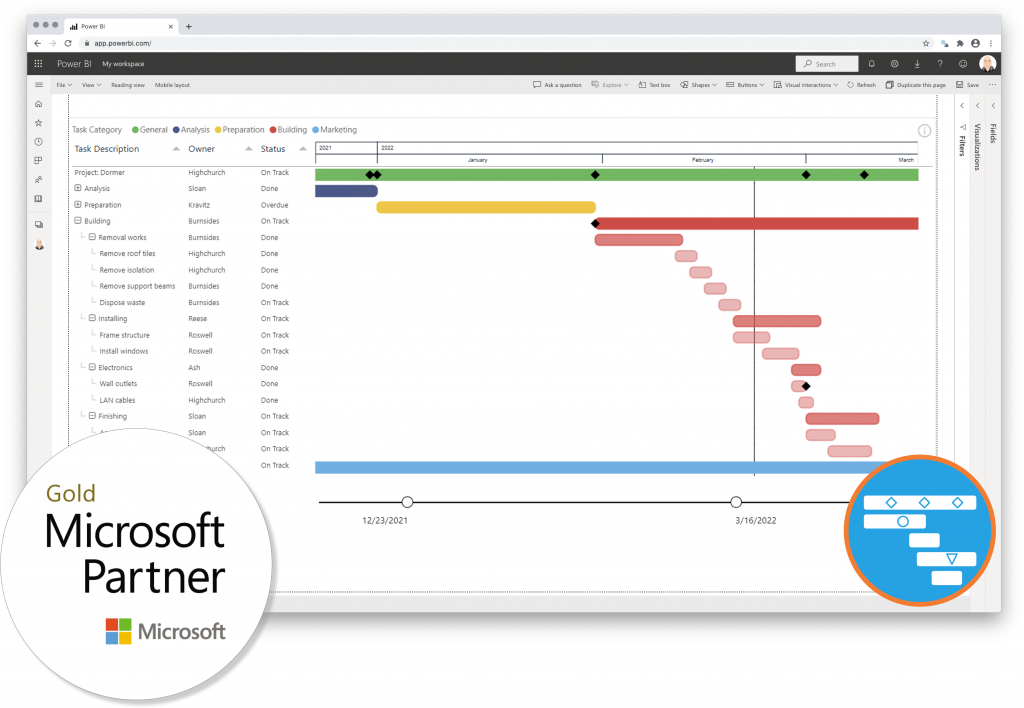
Excellent visualization of your program and project schedules
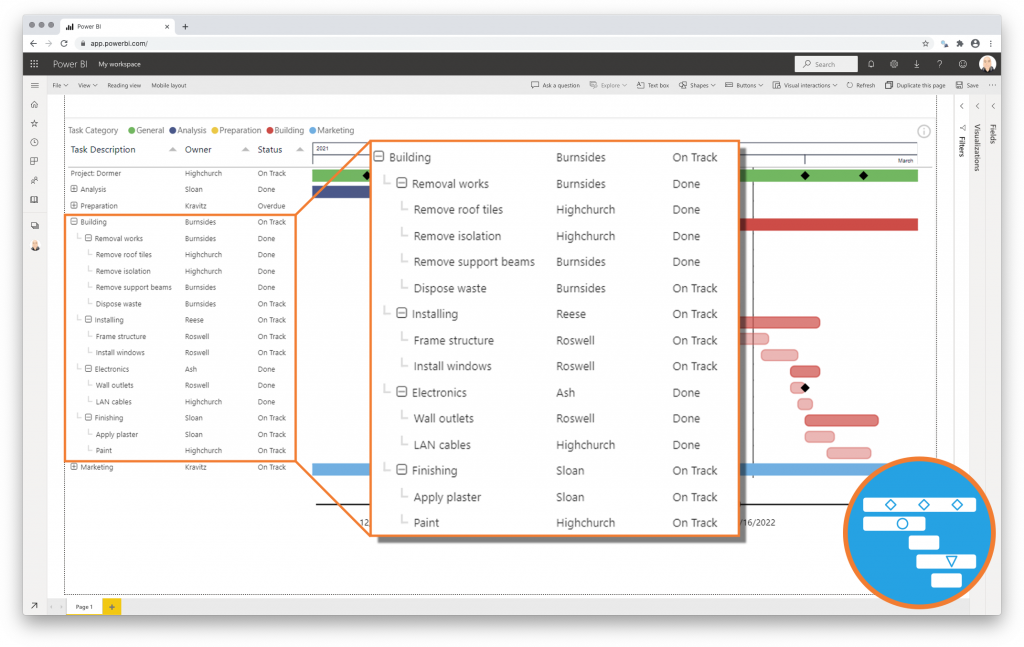
Get a high level overview at first, and dive into details using the collapse/expand buttons. Zoom into specific periods using the interactive Zoom Slider
Unlimited number of tasks, hierarchy levels and milestones
Add as many tasks / hierarchies / levels / milestones as you like to your Gantt Chart. You’ll never have to omit any details on your Gantt Chart
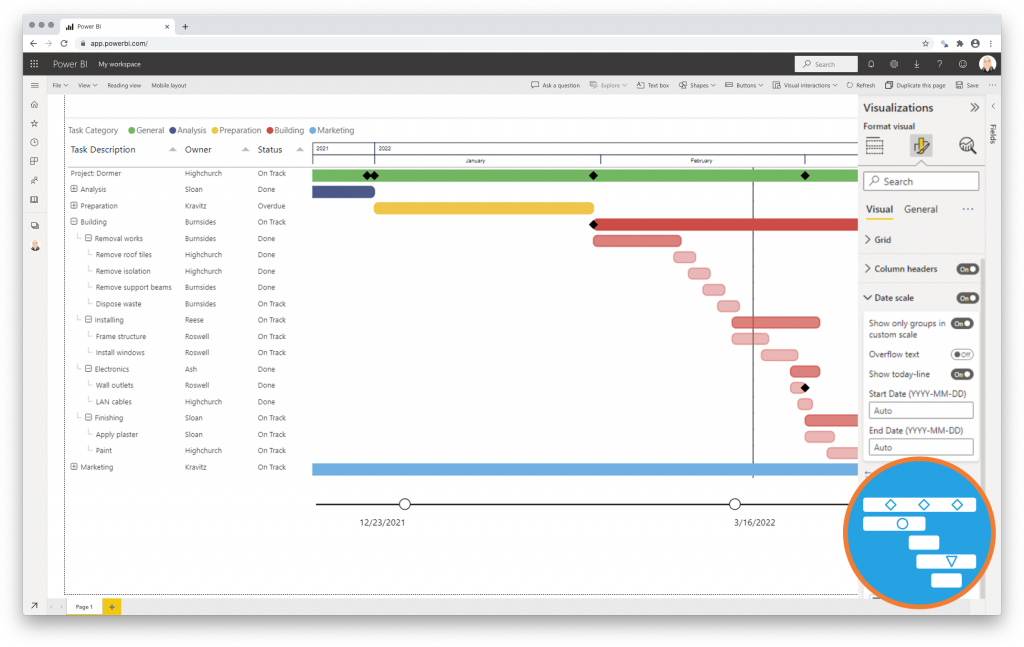
Highly customizable
Add or remove any data column. Change the colors of the bars and milestone markers. You can even use your own custom date hierarchy (like weeks or fiscal years)
Works like any standard Power BI Visual
The formatting options of the Power Gantt Chart are similar to any standard Power BI Visual. No need to learn a new interface. And of course, Power BI Theme settings are supported to save you time.
Certified & Secure
The Power Gantt Chart is a Certified Power BI visual. This means the Microsoft Power BI Team reviews the visual and determines if it meets the Microsoft coding standards. They also verify the visual does not access any external servers or services. Your data is only accessible by you.

Who we are, and why we develop Power BI visuals
Nova Silva, meaning ‘new forest’ in Latin, is a Dutch company and was founded in 2007. The founders came from various roles in management and IT at organizations such as Kappa Packaging, Temtec, IBM, Accenture and Rabobank.
We love to help organizations and their people to get more out of data.
This keeps us learning and become a little better every day. We are constantly looking for the balance between man and machine, automating repetitive tasks and processes and enabling people to be creative and meaningful.
In 2018 we decided to combine our extensive experience in Data Processing and Visualization with Microsoft Power BI. Together with our customers we were missing a number of important visuals. This resulted in developing visuals for Power BI.
Obviously, we can’t do this alone. Besides the valuable feedback from our customers we also work closely together with Microsoft. Therefore we are Gold Microsoft Partner.
Some of our renowned customers
Free trial
This visual can be found at the Microsoft AppSource. Download the visual to evaluate and test all functionality with your own data.
You’ll be redirected to the Microsoft AppSource site.
Choose your license

Questions about the premium or enterprise edition?
I would love to help you!
Michel
Visualisations & Measurement