Tutorial: how to add a horizontal navigation menu to your report
In version 2.0 of the Shielded HTML Viewer we added support for the HTML-tags to allow you to add a horizontal menu to your reports.
We did allow you to use the NAV-tag and we added some default CSS to the visual so you can create your own menu on top of the report. The links you add in your HTML can point to a website or to another report or bookmark.
The HTML Code below does creates a menu with three items (HOME, SHOP & VISUALS) and the last item (VISUALS) has a drop-down menu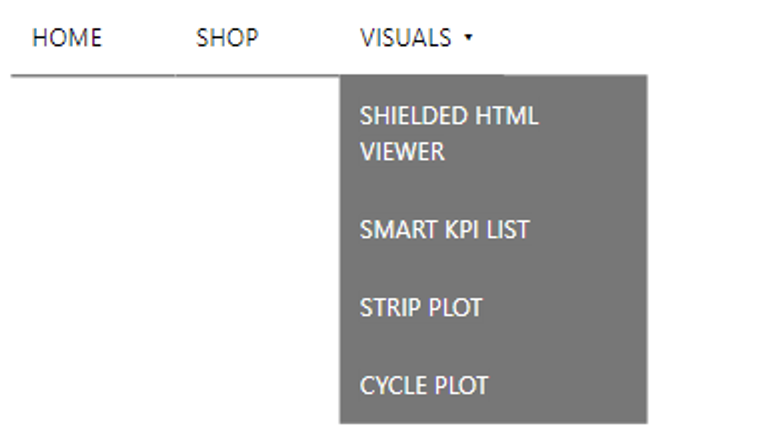
Just add the code below to your dataset and change the names of the items and the links or add more items to the menu.
<nav role="navigation" style="width: 100%">
    <ul style="color: white; background-color: #000" >
        <li style="width: 80px; background-color: #000; padding: 10px;"><a style="color: white" href="https://visuals.novasilva.com">HOME</a></li>
        <li style="width: 80px; background-color: #000; padding: 10px;"><a style="color: white" href="https://visuals.novasilva.com/shop/">SHOP</a></li>
        <li style="width: 80px; background-color: #000; padding: 10px;"><a style="color: white" href="#">VISUALS ▾</a>
            <ul class="dropdown" style="margin-top: 40px;background-color: #777; width: 150px; margin-top: 10px">
                <li style="width: 150px; padding: 10px;"><a style="color: white; background-color: #777;" href="https://visuals.novasilva.com/shop/pbi-visuals/shielded-html-viewer-for-power-bi/">Shielded HTML Viewer</a></li>
                <li style="width: 150px; padding: 10px;"><a style="color: white; background-color: #777;" href="https://visuals.novasilva.com/shop/pbi-visuals/smart-kpi-list-for-power-bi/">Smart KPI List</a></li>
                <li style="width: 150px; padding: 10px;"><a style="color: white; background-color: #777;" href="https://visuals.novasilva.com/shop/pbi-visuals/strip-plot-power-bi/">Strip Plot</a></li>
                <li style="width: 150px; padding: 10px;"><a style="color: white; background-color: #777;" href="https://visuals.novasilva.com/shop/pbi-visuals/cycle-plot-for-power-bi/">Cycle Plot</a></li>
            </ul>
        </li>
    </ul>
</nav>