
Introduction: PowerFin Matrix
Your financial statements in Power BI exactly as published
Finance teams know the workaround: build the report in Power BI, export it to Excel, and reformat it to match what the board actually expects. The Power BI Matrix was designed for general aggregation, not for the fixed line order, custom subtotal names and per-row formatting a published P&L or balance sheet demands.
The PowerFin Matrix closes that gap. Purpose-built for financial reporting, it lets you place subtotals exactly where finance reads them, label them the way finance names them — Gross Profit, EBITDA, Net Result — and apply row, column and cell-level formatting without a proprietary layer. Your DAX format strings, your theme, your data model: the PowerFin Matrix works with what you already have.
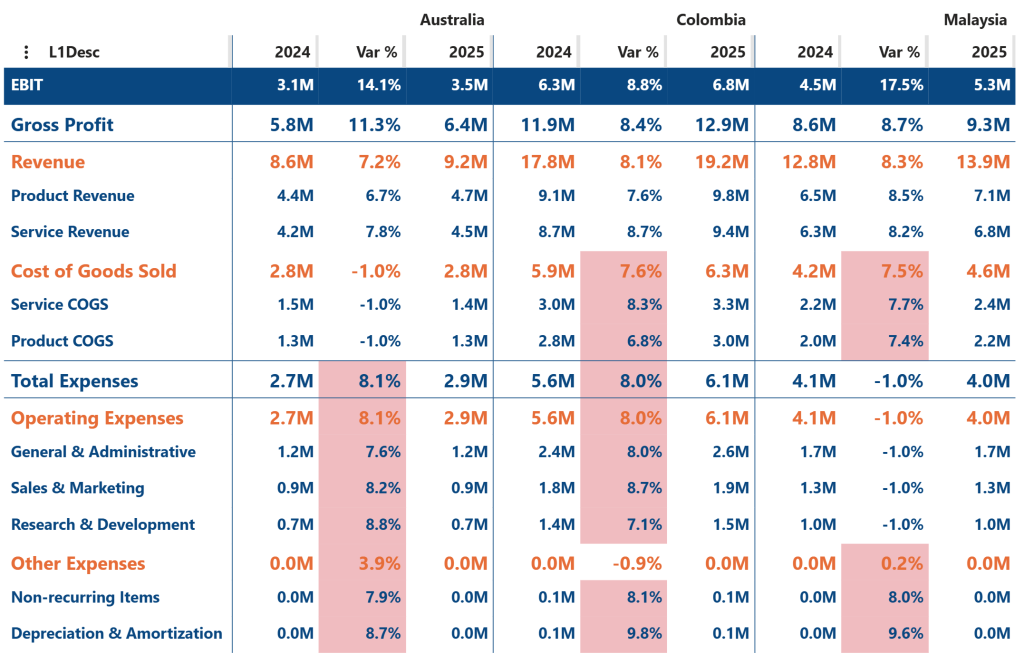
Key features of the PowerFin Matrix are:
- Configurable subtotal placement: Place subtotals at the top, at the bottom, or at a different position per hierarchy level or group — the way a financial statement is actually read.
- Custom subtotal labels: Replace generic “Total” labels with meaningful names such as Gross Profit, EBITDA or Net Result. When a hierarchy has only one parent, the parent’s name automatically replaces “Total”.
- “Of which” detail rows: Show selected detail rows beneath any subtotal without changing the subtotal value — every hidden row still contributes to the math.
- Drag-and-drop ordering: Reorder rows and columns by drag-and-drop. No additional dataset, no DAX index column.
- Per-group columns: When stacking column fields, show different measures per group, and hide individual measures within a specific group.
- Tree view or list view: Switch between an interactive tree view (with expanders and indentation) and a clean list view without +/− icons or indentation, ready for board-level output.
- Per-row, per-column and per-cell formatting: Set lines above subtotals, custom fonts per row, fixed column widths and extensive borders. Apply different formatting for expanded and collapsed states.
- Native Power BI formatting: Honors every DAX format string supplied by Power BI — accounting parentheses, sign flipping, scaling and currencies — without a proprietary formatting layer.
- Conditional formatting and theme support: Full conditional formatting and full Power BI theme integration.
- High performance: Optimized rendering for large financial datasets with deep hierarchies and many measures.
Sample use cases:
- Quarterly and annual reporting: Reproduce P&L, balance sheet and cash flow statements directly inside Power BI.
- Management reporting and board packs: Build executive-ready reports with the structure, subtotal labels and formatting management expects.
- Variance and budget-vs-actual reporting: Combine totals, details and “of which” lines in a single matrix, with per-row formatting for variance columns.
- Statutory and group consolidation: Produce statement-grade output for filings and group reporting.
How to use: Build visual
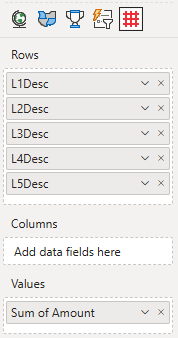
The basics are similar to the standard Power BI Matrix: you specify the Rows, Columns and Values. You need to fill at least the following fields: Rows and Values. Once you have the data selected in the PowerFin Matrix you can start to format the matrix to fit your needs.
- Rows: Add one or more categories that define the row hierarchy of your financial statement. Place the highest level first (e.g. account category) and work down to the most granular level (e.g. account description).
- Columns: Add one or more categories to create column groups. When you add a single category, the visual displays one column per member. When you stack multiple fields, the visual creates nested column groups.
- Values: Add one or more values. DAX format strings applied to your measures are honored automatically, including accounting parentheses, sign flipping, scaling and currency symbols.

How to use: Format visual
The available formatting options are:
- License: here you can enter your PREMIUM license information to activate the visual with a premium license. These fields are not used for the PER USER license.
- Table:
- Display mode: Tree (default)/ List if On
- Respect Tree expand state (On)
- Allow expand/collapse in View mode (On)
- Totals: Above/ Below
- Balanced data (Off)
- Border: Width, Color, Style (Dashed, Solid, Dotted)
- Display mode: Tree (default)/ List if On
- Rows:
- Height: Auto (value must be greater than or equal to 10 or less than 100)
- Padding: (value must be less than or equal to 10)
- Apply settings to: All rows/ or per row/ Total position override
- If you choose a row then Show subtotals (On)
- In focus mode change totals position then a Total position override gets enabled, and you can set Row headers Prefix & Indentation
- Expand state: All rows/ Expanded rows/ Collapsed rows
- Background: Color/ Transparency
- Style: Font/ Size/ B, I, U/ Color
- Border:
- Apply settings to: top, bottom
- Width / Color/ Style: None, Dashed, Solid, Dotted
- Values: set Display units (Auto, None, Thousands, Millions, Billions, Trillions) and Decimal places.
- Row headers:
- Title: rename here the row header
- Background: Color/ Transparency/ Apply to header (Off)
- Style: Font/ Size/ B, I, U/ Color
- Columns:
- Width
- Background: Color/ Transparency/ Apply to header (Off)/ Conditional color palette (Off)
- Style: Horizontal alignment (L, C, R)/ Font/ Size/ B, I, U/ Color
- Border:
- Apply settings to: left, right
- Width / Color/ Style: Dashed, Solid, Dotted
- Values: set Display units (Auto, None, Thousands, Millions, Billions, Trillions) and Decimal places.
- Column headers:
- Background: Color/ Transparency
- Style: Font/ Size/ B, I, U/ Color/ Word wrap (Off)
- Border:
- Apply settings to: top, bottom / Width / Color/ Style: None, Dashed, Solid, Dotted
- Apply settings to: Rows, Columns and Total
- Horizontal alignment: L, C, R
- Subtotal columns (default Off):
- Title: rename here the subtotal columns.
- Position: After/ Before
- Inherit from columns (On) if Off:
- Background: Color/ Transparency/ Apply to header (Off)
- Style: Horizontal alignment (L, C, R)/ Font/ Size/ B, I, U/ Color
- Border:
- Apply settings to: left, right
- Width / Color/ Style: Dashed, Solid, Dotted
- Values: set Display units and Decimal places
- Total columns (default Off):
- Title: rename here the total columns.
- Use unique Column title (On)
- Position: set the total column After or Before.
- Apply settings to (available when you have more than one value)
- Inherit from columns (default On) if Off:
- Background: Color/ Transparency/ Apply to header (default Off)
- Style: Horizontal alignment (L, C, R)/ Font/ Size/ B , I, U/ Color
- Border:
- Apply settings to: left, right
- Width / Color/ Style: Dashed, Solid, Dotted
- Values: set Display units (Auto, None, Thousands, Millions, Billions, Trillions) and Decimal places.
How to use: Focus mode
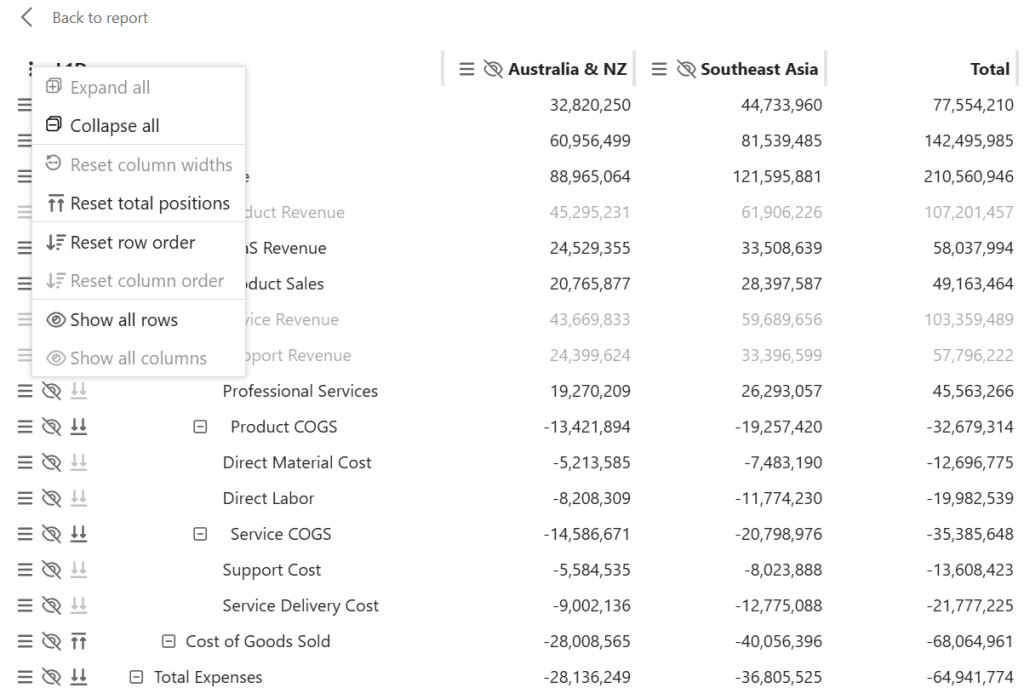
Open Focus mode to access to a set of options for adjusting the layout of the PowerFin Matrix directly in the report view. Click the arrow-in-box icon in the top-or bottom-right corner of the visual, between the filter and More options icons.
Available options:
- Expand all: Available in Tree display mode only. Expands all row groups, showing every detail row across all hierarchy levels.
- Collapse all: Available in Tree display mode only. Collapses all row groups to the top hierarchy level, hiding all detail rows at once.
- Reset column widths: Restores all column widths to their default size, undoing any manual width adjustments (↔) made in Focus mode.
- Reset total positions: Available in Tree display mode only. Restores all subtotal rows to their original configured position, undoing any repositioning (⇊) made in Focus mode.
- Reset row order: Restores all rows to their original order, undoing any manual reordering (≡) made in Focus mode.
- Reset column order: Restores all columns to their original order, undoing any manual reordering (≡) made in Focus mode.
- Show all rows: Makes all hidden rows visible again, including any rows that were individually hidden using the hide icon (👁).
- Show all columns: Makes all hidden columns visible again, including any columns that were individually hidden using the hide icon (👁).
With the exception of Expand all and Collapse all, these options are available to the report developer only. Report viewers will see Expand all and Collapse all, if the report developer has not disabled this via the Allow expand/collapse in View mode option.
How to use: Examples
Display mode
The PowerFin Matrix offers two display modes: Tree and List. Both are available under Format visual > Table > Display mode.
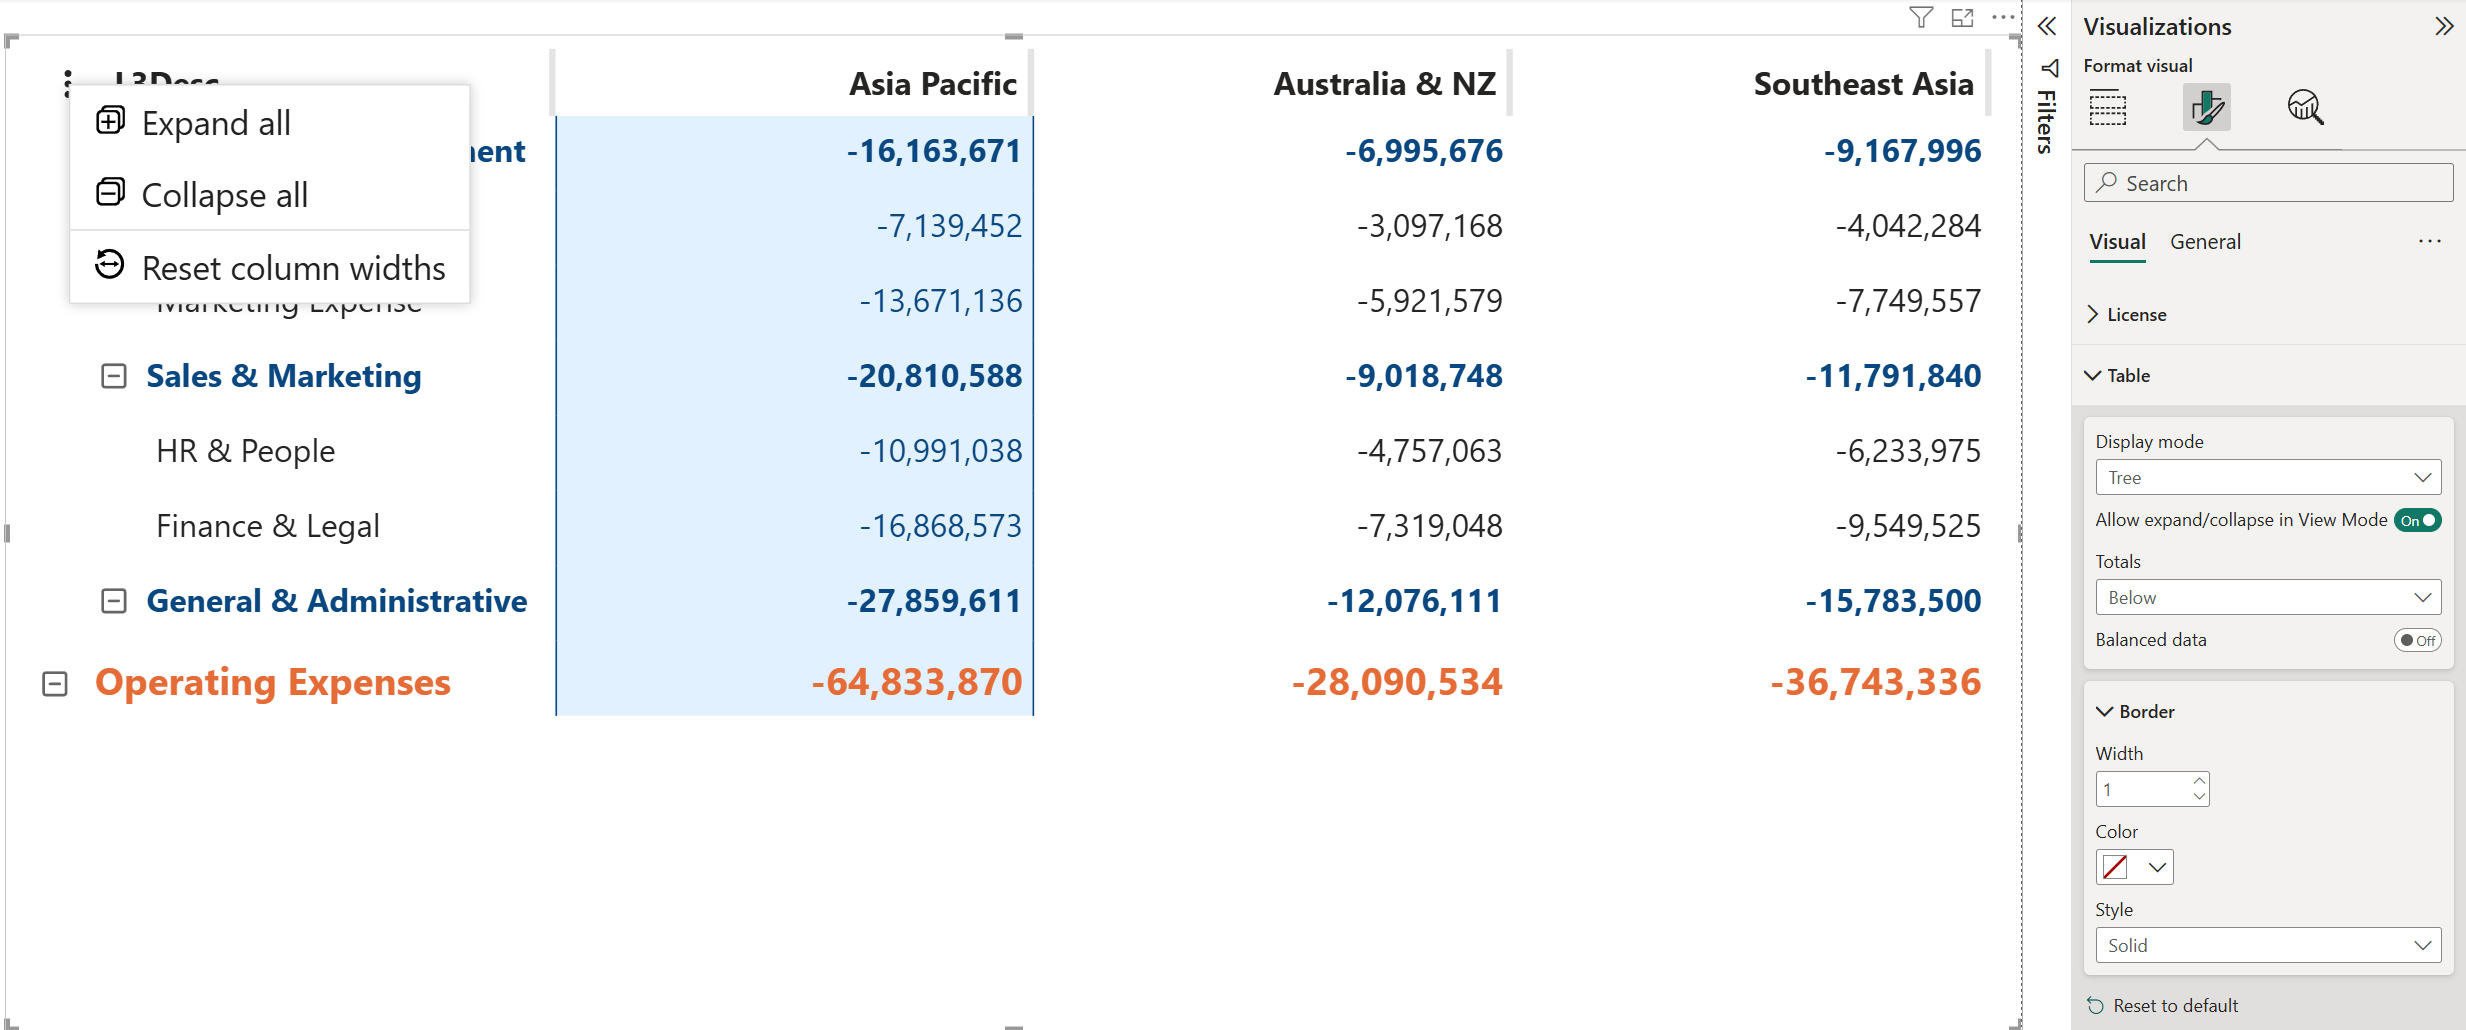
Display mode: Tree
By default, the PowerFin Matrix displays the row hierarchy as a tree. Rows are grouped with expand (⊞) and collapse (⊟) icons, and indentation shows the hierarchy level. This lets report viewers navigate between summary and detail, expanding a group to inspect the underlying lines, or collapsing it to keep the view clean.
Individual groups can be expanded or collapsed by clicking the ⊞/⊟ icon next to the row. To expand or collapse all groups at once, click the vertical ellipsis icon (⋮) in the top-left corner of the visual and select Expand all or Collapse all.
The report developer controls whether viewers can do this in the published report. When Allow expand/collapse in View Mode is on (default), viewers can expand and collapse groups themselves. Turn it off to lock the current expand state and prevent changes. This is useful when you want to deliver a fixed board-ready layout that viewers cannot accidentally collapse.
Display mode: List
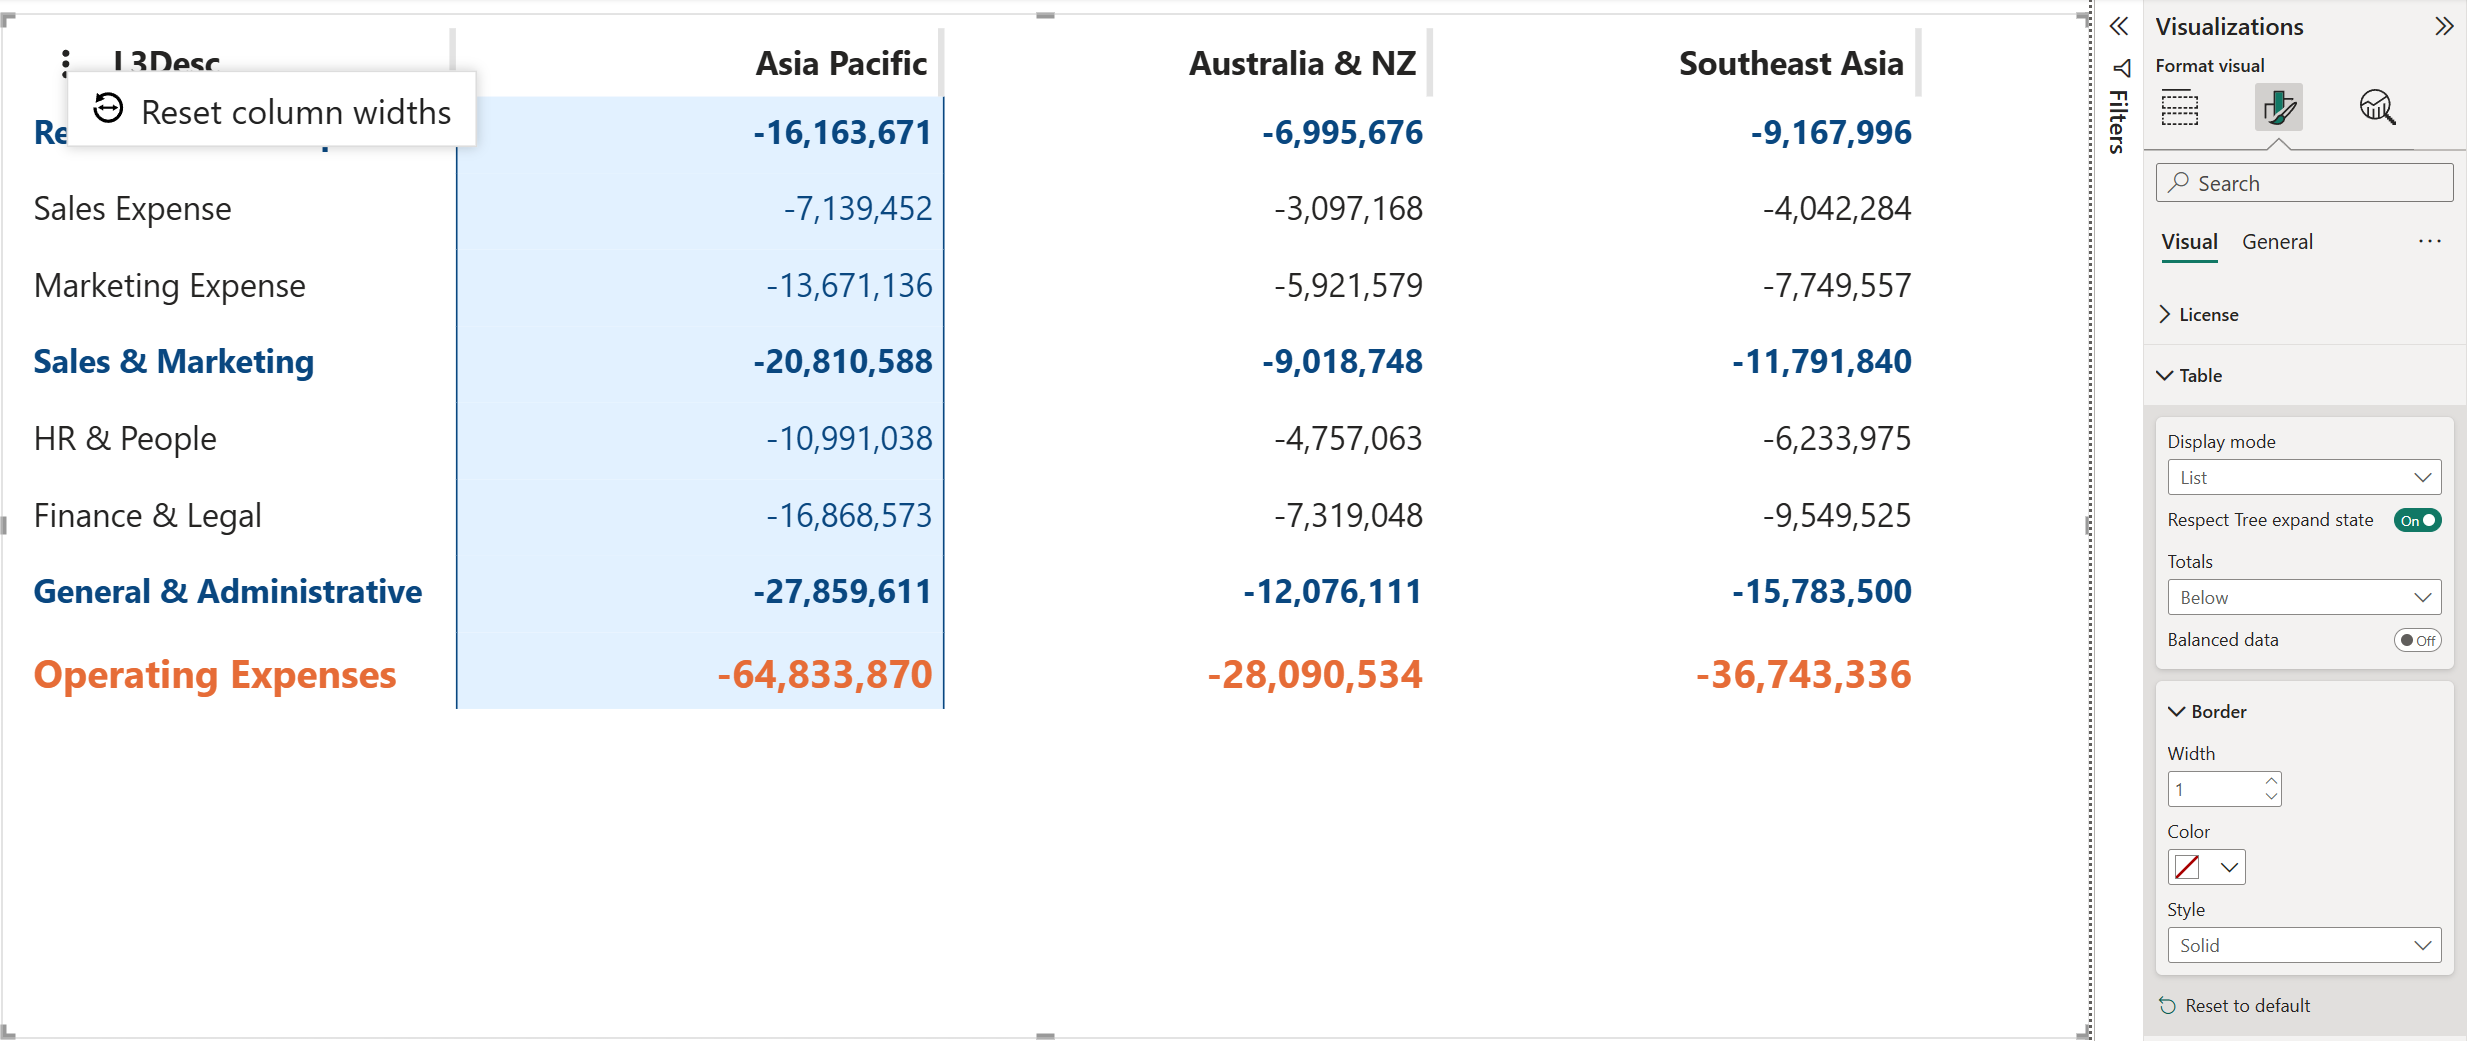
In List mode, the row hierarchy is shown as a flat list. The expand/collapse icons and indentation disappear, giving the table a cleaner, publication-ready appearance. Switch to List under Format visual > Table > Display mode.
By default, Respect Tree expand state is on. This means the List view shows only the rows that are currently expanded in Tree mode; so a row group you collapsed in Tree mode stays hidden in List mode. The report developer can turn Respect Tree expand state off to display all rows regardless of the Tree expand state.
A common workflow is to use Tree display mode while building and reviewing the report, then switch to List mode for the final board output, with the exact rows visible that you confirmed in Tree mode.
Adjusting column widths
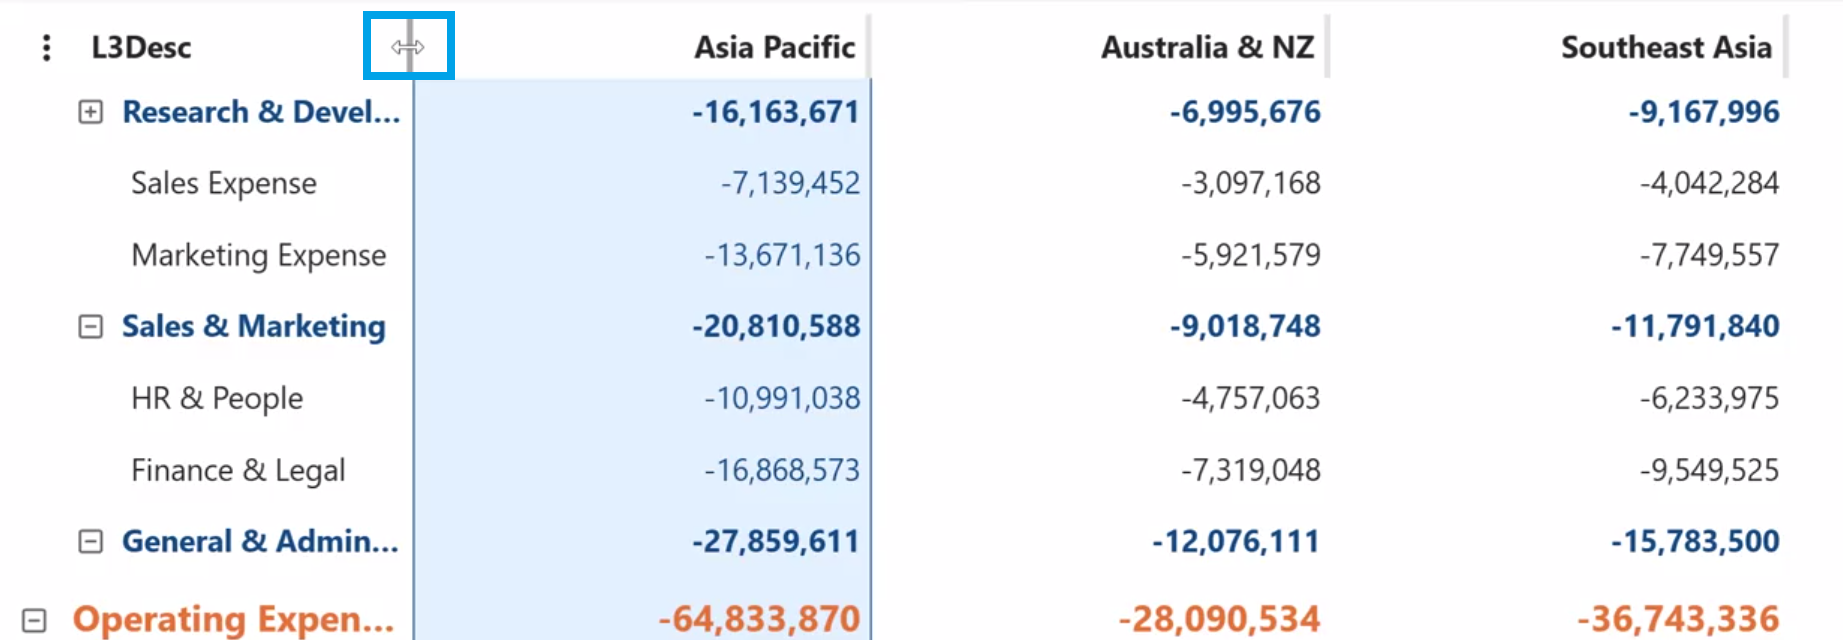
Resize columns to improve the readability of the visual. You can adjust column widths manually by dragging column borders, or set a uniform width for all columns at once in the Format visual pane. Column widths can only be adjusted in Edit mode, in Power BI Desktop or in Power BI Service.
Adjusting column widths manually
To adjust individual column widths manually:
- Hover over the boundary between two column headers.
- When the cursor changes to a left-right arrow (↔), click and drag.
- Drag right to widen the column, or left to narrow it.
- Release the mouse button when the column is the desired width.
- Repeat for any other columns as needed.
Setting column width via the Format pane
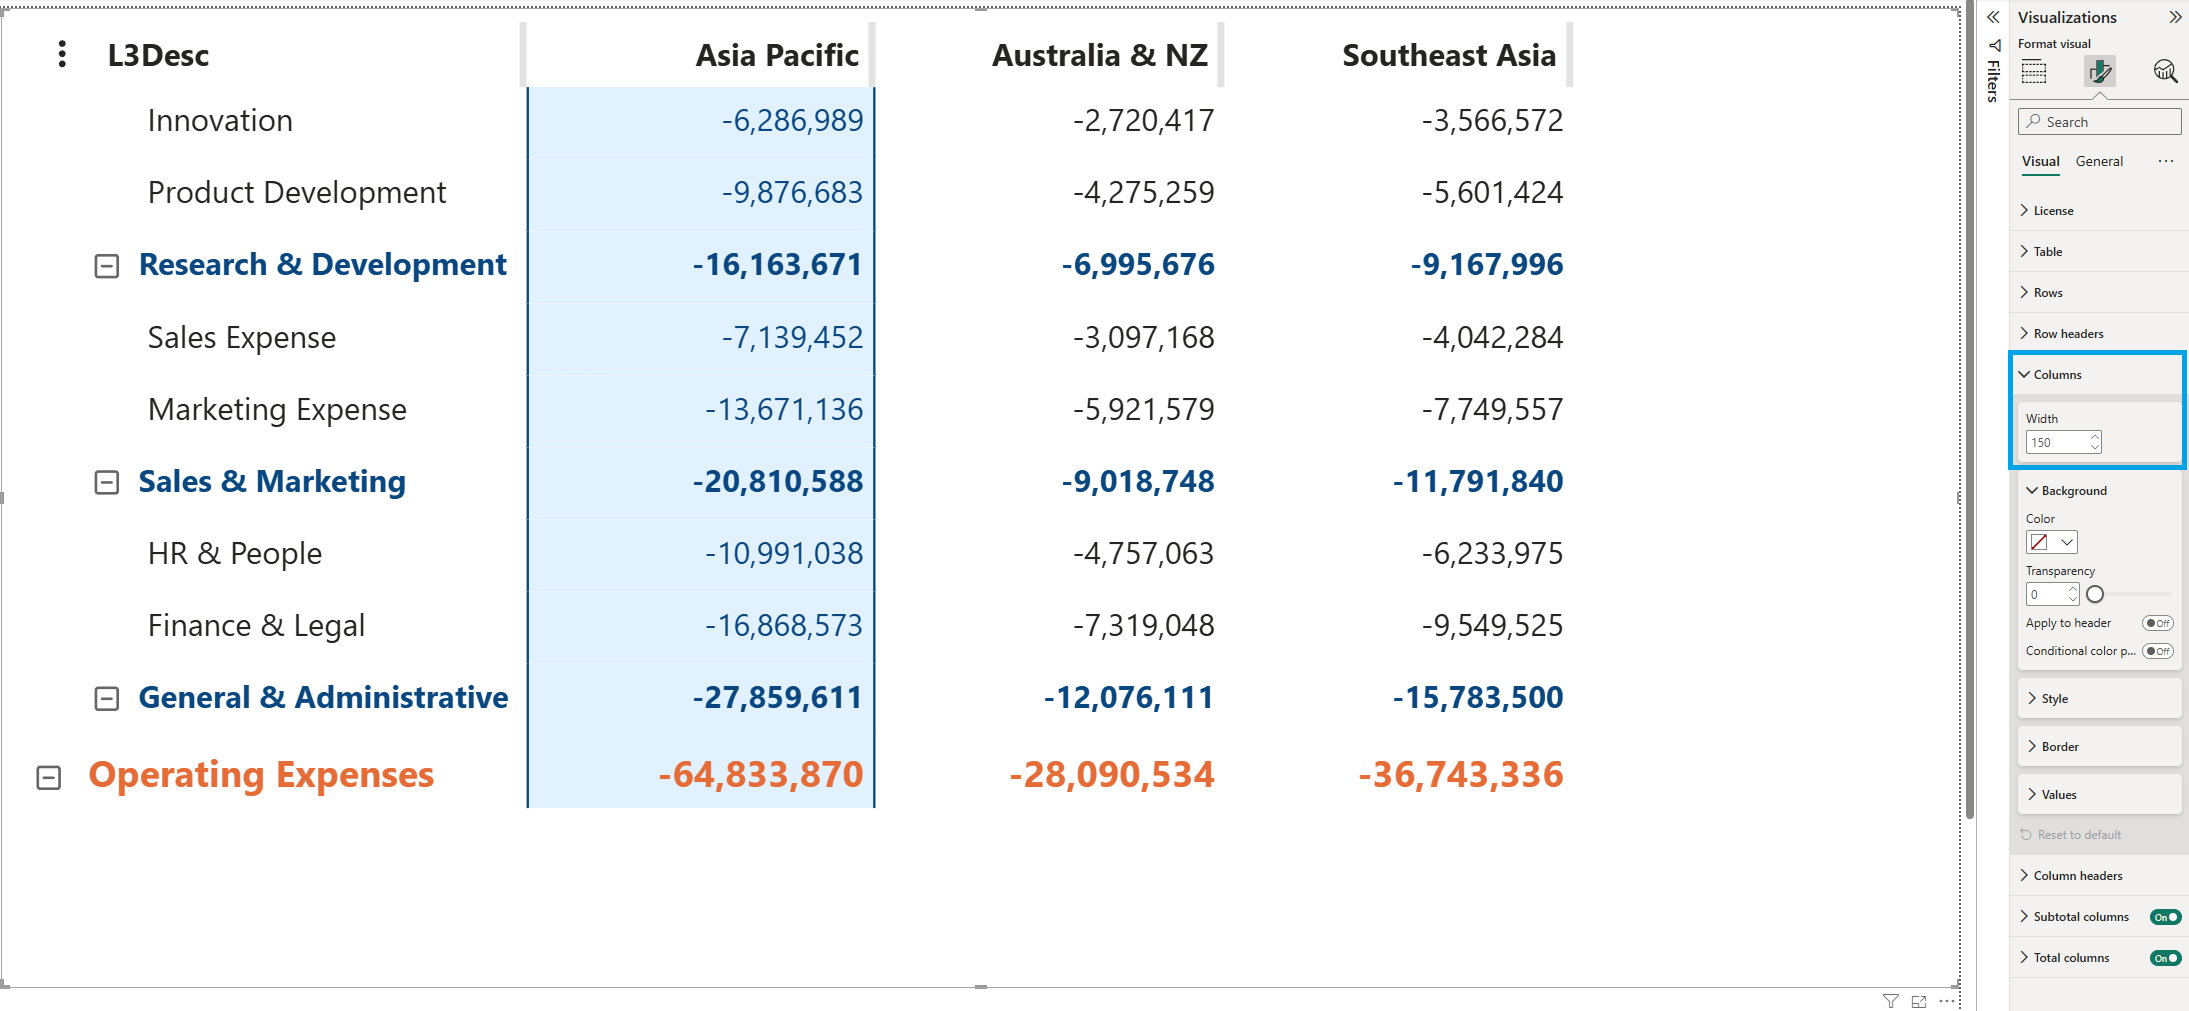
You can also set the Column width for all columns at once in the Format visual pane: go to Format visual > Columns > Width. The default value is 150.
Resetting column widths
Reset all columns to their default width:
- Vertical ellipsis menu (⋮): To undo all manual column width adjustments at once, open the vertical ellipsis menu in the top-left corner of the visual and select Reset column widths. Available in Edit mode (Power BI Desktop and Service).
- Focus mode: To undo all manual column width adjustments at once, open Focus mode by clicking the arrow-in-box icon in the top or bottom-right corner of the visual, then select Reset column widths from the vertical ellipsis menu. Available in Edit mode (Power BI Desktop and Service).
- Format visual pane: To undo all column width adjustments done via Format visual pane setting, go to Columns > Width and select Reset to default, or enter a new number.
Manually adjusted columns take priority over the Format visual pane setting. Changing the Width value in the format pane only applies to columns you haven’t resized manually. To apply Width value to all columns, first select Reset column widths via the ellipsis menu or Focus mode, the previously manually adjusted columns will then take on the Width value as well.
Reordering and hiding columns
When you have multiple levels of columns, Focus mode gives you direct control over the order and visibility of both groups and individual columns. Open Focus mode by clicking the arrow-in-box icon in the top or bottom-right corner of the visual.
In Focus mode, each column header shows two icons:
- Reorder icon (≡):drag-and-drop to move the column or column group to a new position.
- Hide icon (eye slash): click to hide the column or column group.
Reordering columns
Click the Reorder icon (≡) on a column header and drag-and- drop to reorder it. You can reorder:
- A whole column group: drag-and-drop the ≡ icon in the group header (e.g. Australia & NZ) to move all its columns together.
- An individual column within a group: drag-and-drop the ≡ icon on the specific column header (e.g. the numbered columns within Australia & NZ & Southeast Asia) to move it independently within the group.
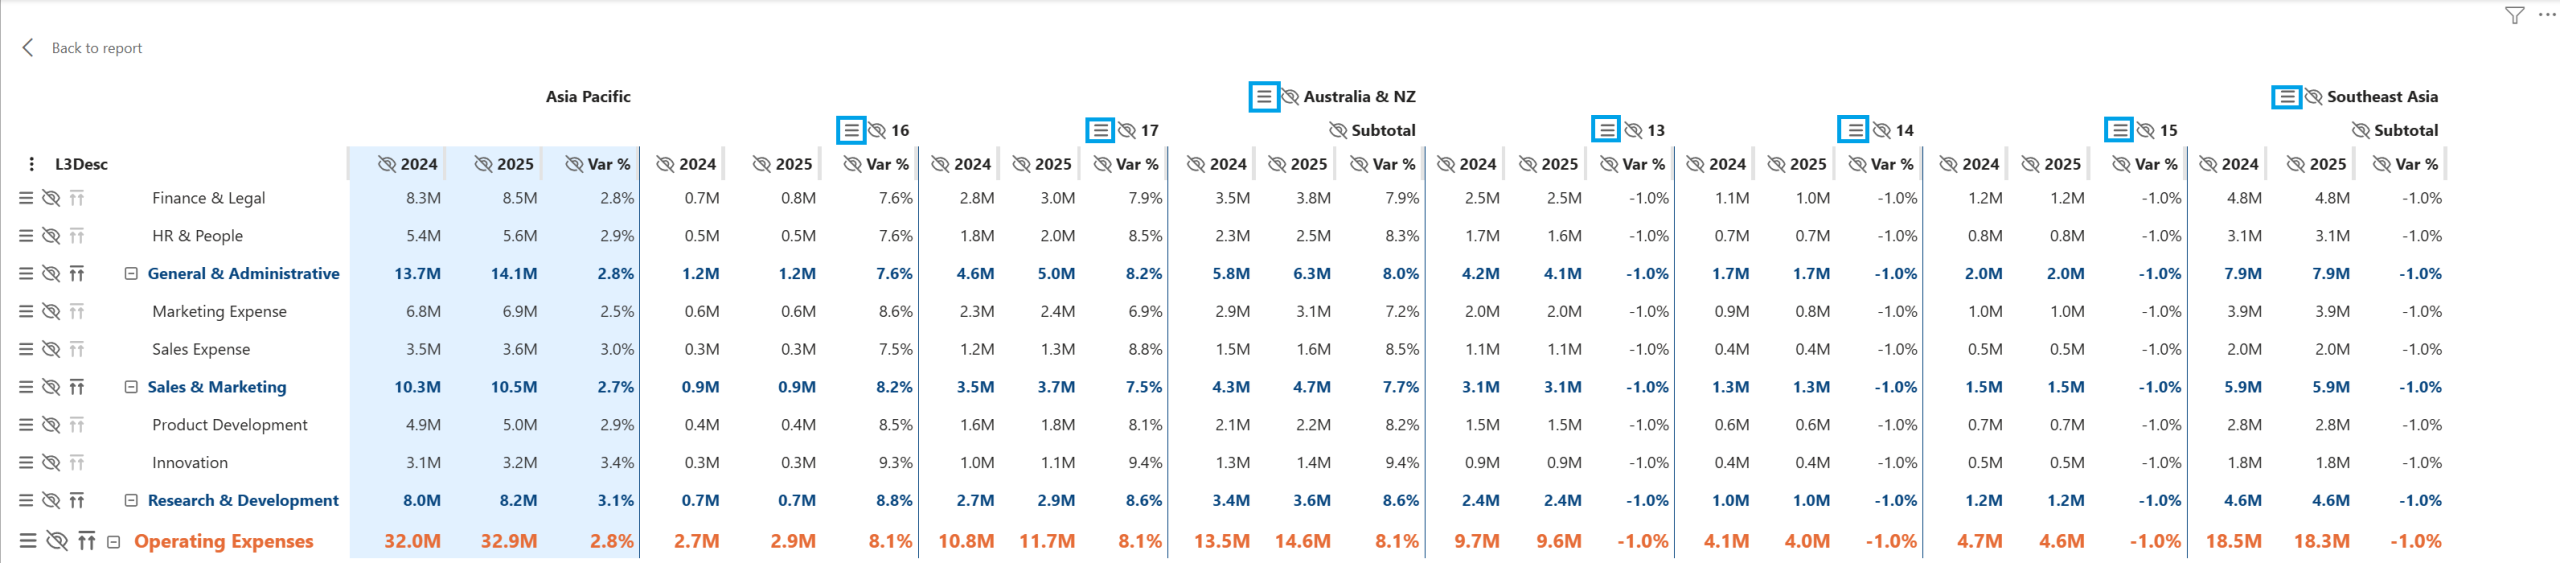
The order of the columns is persisted. To restore the original column order, open the vertical ellipsis menu (⋮) in the top-left corner of the visual and select Reset column order.
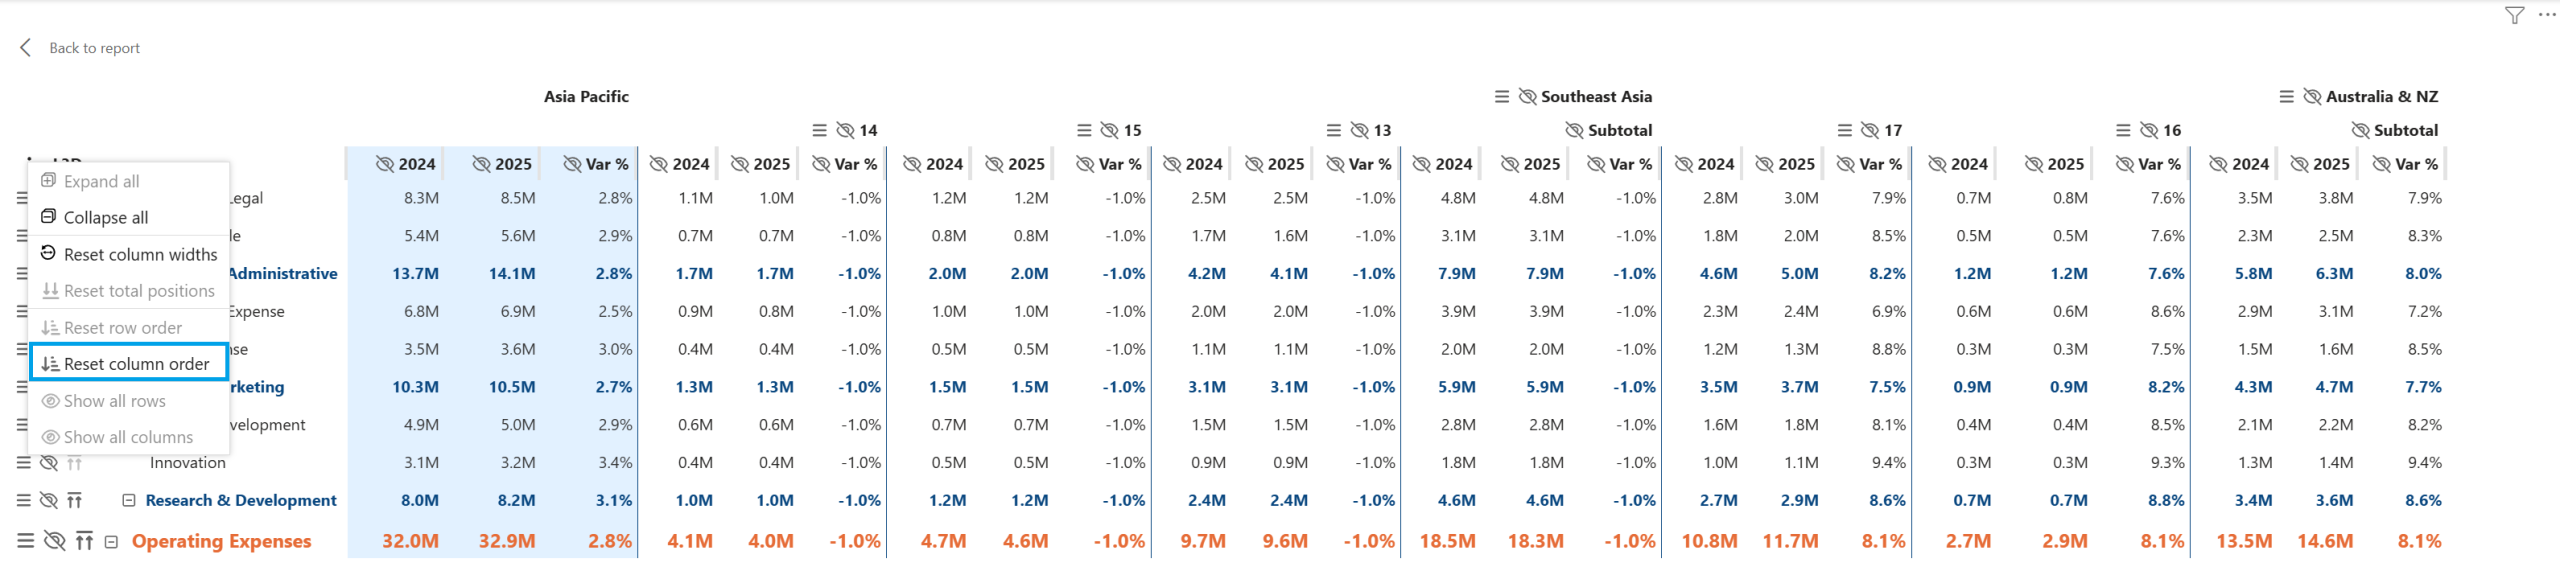
Reordering applies to the columns mapped in the Columns well. To reorder values, change the order in the Values well. Total columns aren’t reordered via drag-and-drop, use the formatting cards to set their Position to Before or After (default).
Hiding columns
Click the Hide icon (eye slash) on a column header to hide it. You can hide:
- A whole column group: click the hide icon in the group header (e.g. Australia & NZ). All columns within that group are hidden at once and the group header is greyed out.
- An individual column within a group: click the hide icon on the specific column header (e.g. a numbered column within Southeast Asia). The other columns in the group remain visible.
Hidden columns are indicated by an eye icon (👁) and appear greyed out in Focus mode, so you can always see what is hidden at a glance.
To make hidden columns visible again, either click the Show icon (👁) on the column directly, or open the vertical ellipsis menu (⋮) and select Show all columns to restore everything at once.
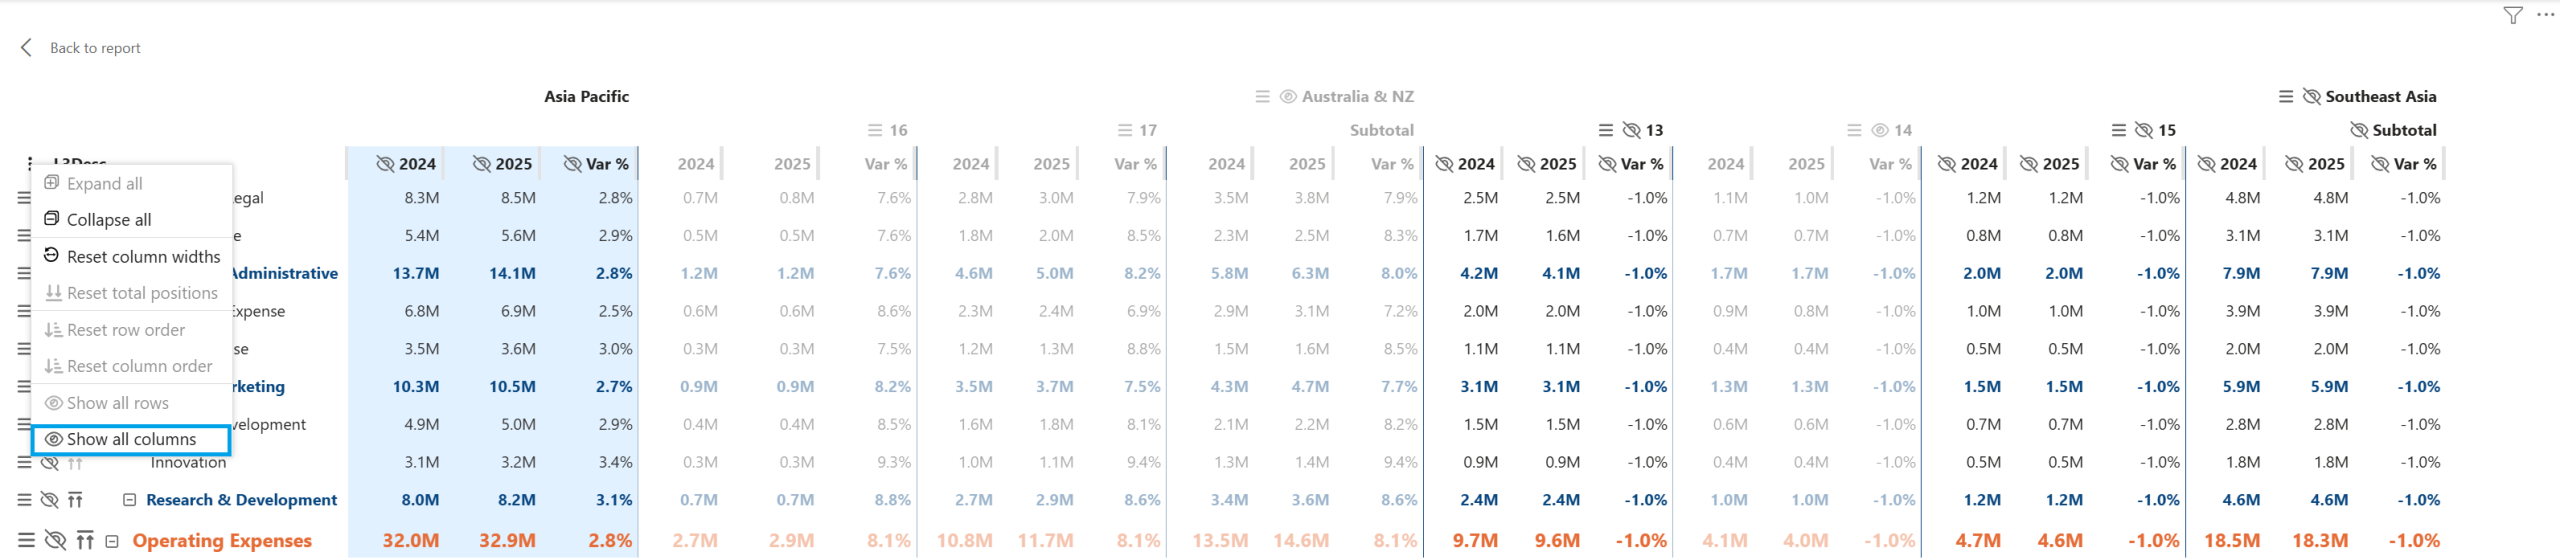
Reordering and hiding columns require Edit mode, in either Power BI Desktop or Power BI Service, and are only available from Focus mode.
Reordering and hiding rows
Open Focus mode by clicking the arrow-in-box icon in the top or bottom-right corner of the visual.
In Focus mode, each row shows two icons:
- Reorder icon (≡): drag-and-drop to move the row to a new position.
- Hide icon (eye slash): click to hide individual rows.
Reordering rows
Click the Reorder icon (≡) on a row and drag-and-drop to reorder it. Rows can only be reordered within the same level of the hierarchy.
- While dragging, a blue line with a hand appears between rows to mark a valid drop position.
- If you drag over an invalid position (e.g. a different hierarchy level), a “not allowed” icon (🚫) appears to indicate the drop is not permitted.
The order of the rows is persisted. To restore the original column order, open the vertical ellipsis menu (⋮) in the top-left corner of the visual and select Reset row order.
Hiding rows
Click the Hide icon (eye slash) on a row to hide it. Hidden rows are indicated by an eye icon (👁) and appear greyed out in Focus mode, so you can always see what is hidden at a glance.
Hiding is applied per row only, it does not cascade to children. If you hide a collapsed parent row, its children stay hidden as long as the parent stays collapsed, but they will still appear if the hierarchy is expanded:
- In Tree mode, if the user does Expand all, the children of a hidden parent will show up, even though the parent itself remains hidden.
- In List mode, if Respect Tree expand state is set Off, all children will show up.
To make hidden rows visible again, either click the Show icon (👁) on the row directly, or open the vertical ellipsis menu (⋮) and select Show all rows to restore everything at once.
Reordering and hiding rows require Edit mode, in either Power BI Desktop or Power BI Service, and are only available from Focus mode.