
Description
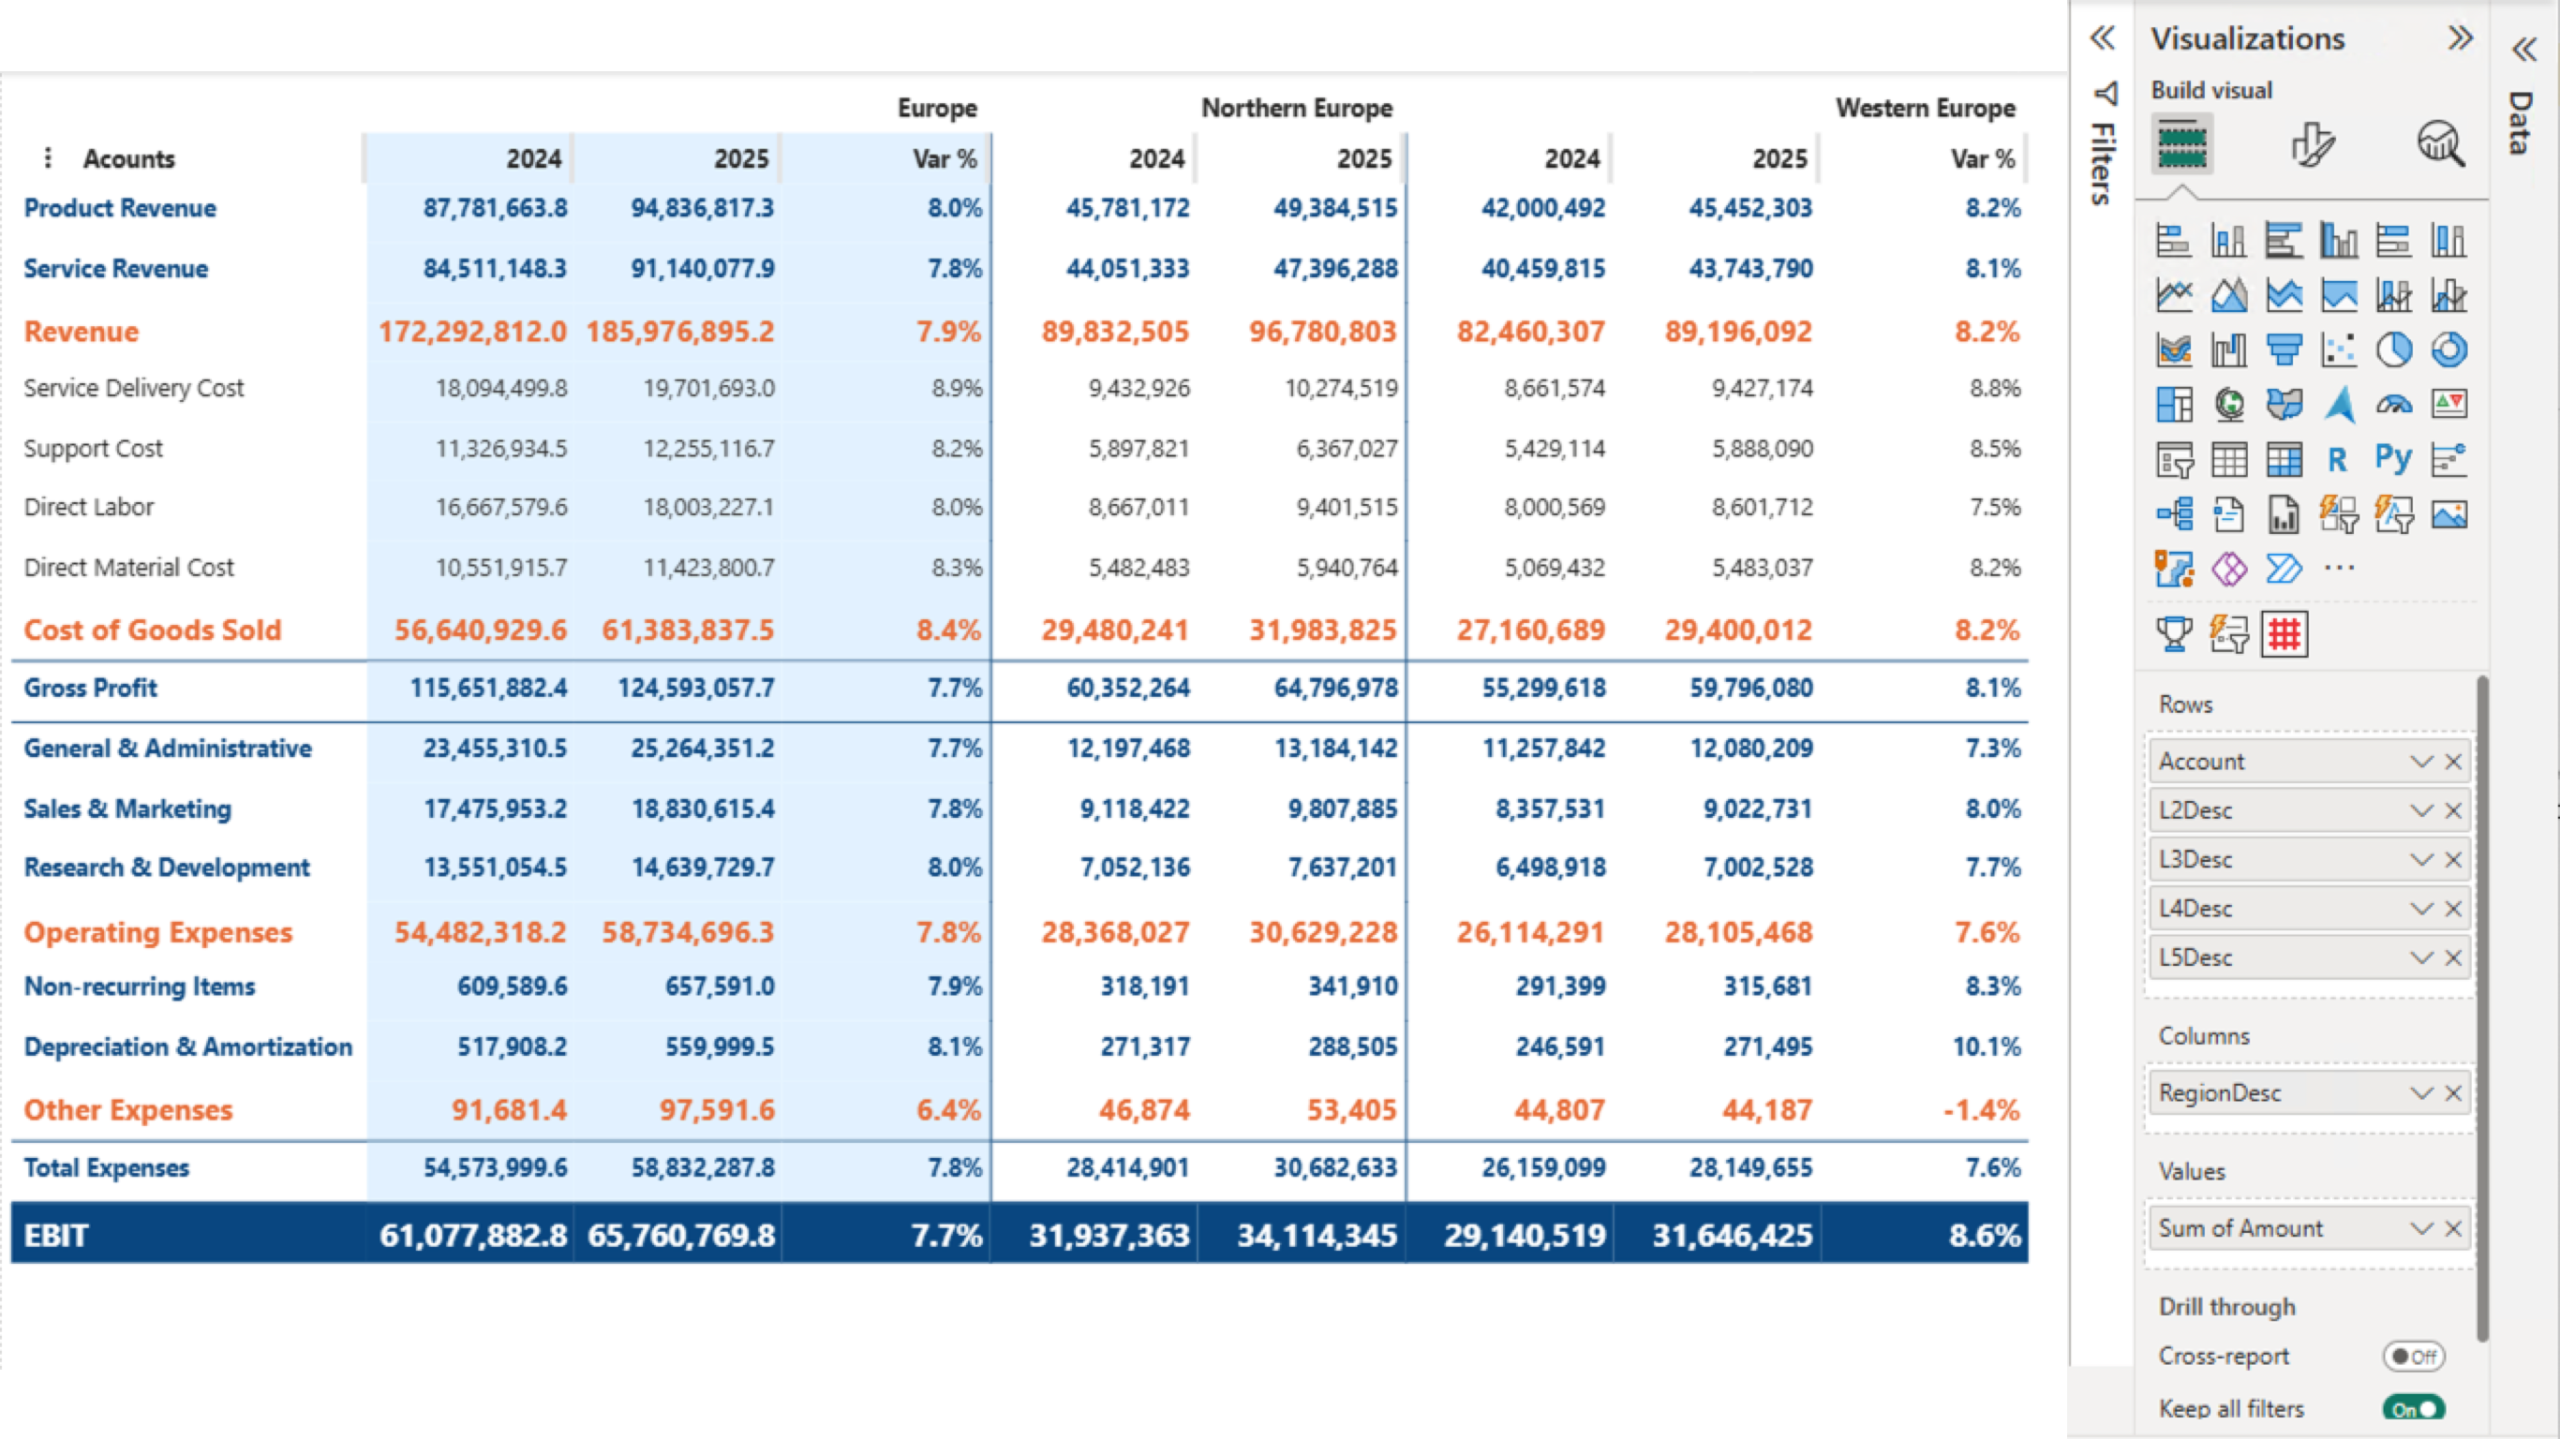
Financial statements — the profit & loss statement, the balance sheet and the cash flow statement — are among the most rigorously formatted reports a finance team produces. They have a fixed line order, custom subtotal names like Gross Profit, EBITDA or Net Result, accounting-style sign conventions, and per-row formatting that is read at a glance by stakeholders, auditors and boards.
The standard matrix in Power BI was designed for general aggregation. It places subtotals at the top of their details, labels them all “Total”, repeats the same columns underneath every group, and offers limited control over the look of individual rows or cells. Reproducing a published financial statement inside this matrix is at best a workaround — and often forces finance teams back into Excel.
The PowerFin Matrix for Power BI lets you build financial statements as they are actually published. It lets you place subtotals at the top, at the bottom, or at a different position per hierarchy level or group; allows custom labels for any total; supports “of which” detail rows that explain a subtotal without changing its value; gives you full row, column and cell-level formatting control; and respects every DAX format string Power BI supplies.
Key features of the PowerFin Matrix are:
- Configurable subtotal placement: Place subtotals at the top, at the bottom, or at a different position per hierarchy level or group — the way a financial statement is actually read;
- Custom subtotal labels: Replace generic “Total” labels with meaningful names such as Gross Profit, EBITDA or Net Result. When a hierarchy has only one parent, the parent’s name automatically replaces “Total”;
- “Of which” detail rows: Show selected detail rows beneath any subtotal without changing the subtotal value — every hidden row still contributes to the math;
- Drag-and-drop ordering: Reorder rows and columns by drag-and-drop. No additional dataset, no DAX index column;
- Per-group columns: When stacking column fields, show different measures per group, and hide individual measures within a specific group;
- Tree view or list view: Switch between an interactive tree view (with expanders and indentation) and a clean list view without +/− icons or indentation, ready for board-level output;
- Per-row, per-column and per-cell formatting: Set lines above subtotals, custom fonts per row, fixed column widths and extensive borders. Apply different formatting for expanded and collapsed states;
- Native Power BI formatting: Honors every DAX format string supplied by Power BI — accounting parentheses, sign flipping, scaling and currencies — without a proprietary formatting layer;
- Conditional formatting and theme support: Full conditional formatting and full Power BI theme integration;
- High performance: Optimized rendering for large financial datasets with deep hierarchies and many measures.
Benefits:
- Faithful reproduction of published statements: Reproduce P&L, balance sheet and cash flow reports in Power BI with the layout, labels and formatting that match what your organization already publishes;
- Less time spent in Excel: Replace the export-to-Excel workaround with a Power BI native visual that matches finance presentation requirements;
- Familiar formatting controls: Excel-grade row, column and cell formatting, and full respect for the Power BI conventions you already use.
Sample use cases:
- Quarterly and annual reporting: Reproduce P&L, balance sheet and cash flow statements directly inside Power BI;
- Management reporting and board packs: Build executive-ready reports with the structure, subtotal labels and formatting management expects;
- Variance and budget-vs-actual reporting: Combine totals, details and “of which” lines in a single matrix, with per-row formatting for variance columns;
- Statutory and group consolidation: Produce statement-grade output for filings and group reporting.
All functionality of the PowerFin Matrix is available for free to try within Power BI Desktop. A licensed version is available for production usage and sharing the reports with your colleagues in Power BI Service.


Reviews
There are no reviews yet.