Power Gantt Chart for Power BI

(2 customer reviews)

From: 1.80 / user / month

Powerful insight into your planning and milestone performance

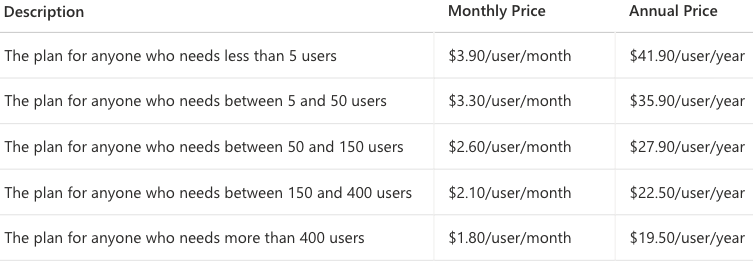
You can purchase and assign your licenses directly through the Microsoft AppSource. Each user (both Creators and Viewers) needs a valid license. The following table shows the  prices in US Dollars.

When using this visual within a Power BI Premium environment you can also acquire the Premium license of this visual (unlimited number of users). This can be found here: Power Gantt for Power BI Premium

SKU: pg-umsa01 Category:

Description

The Gantt chart is an excellent tool to visualize your program and project schedules and task dependencies. In the basis, it is a bar chart with tasks or activities on the vertical axis. The horizontal bars show for each task/activity the period between the start and end date (or time). Another important feature of the Gantt chart is that icons can be used to represent milestones: important moments within your project timeline.

The Power Gantt Chart for Power BI allows you to review both tasks/activities and milestones right in your Power BI reports. The Power Gantt Chart supports unlimited number of task/activities, hierarchy levels and milestones.
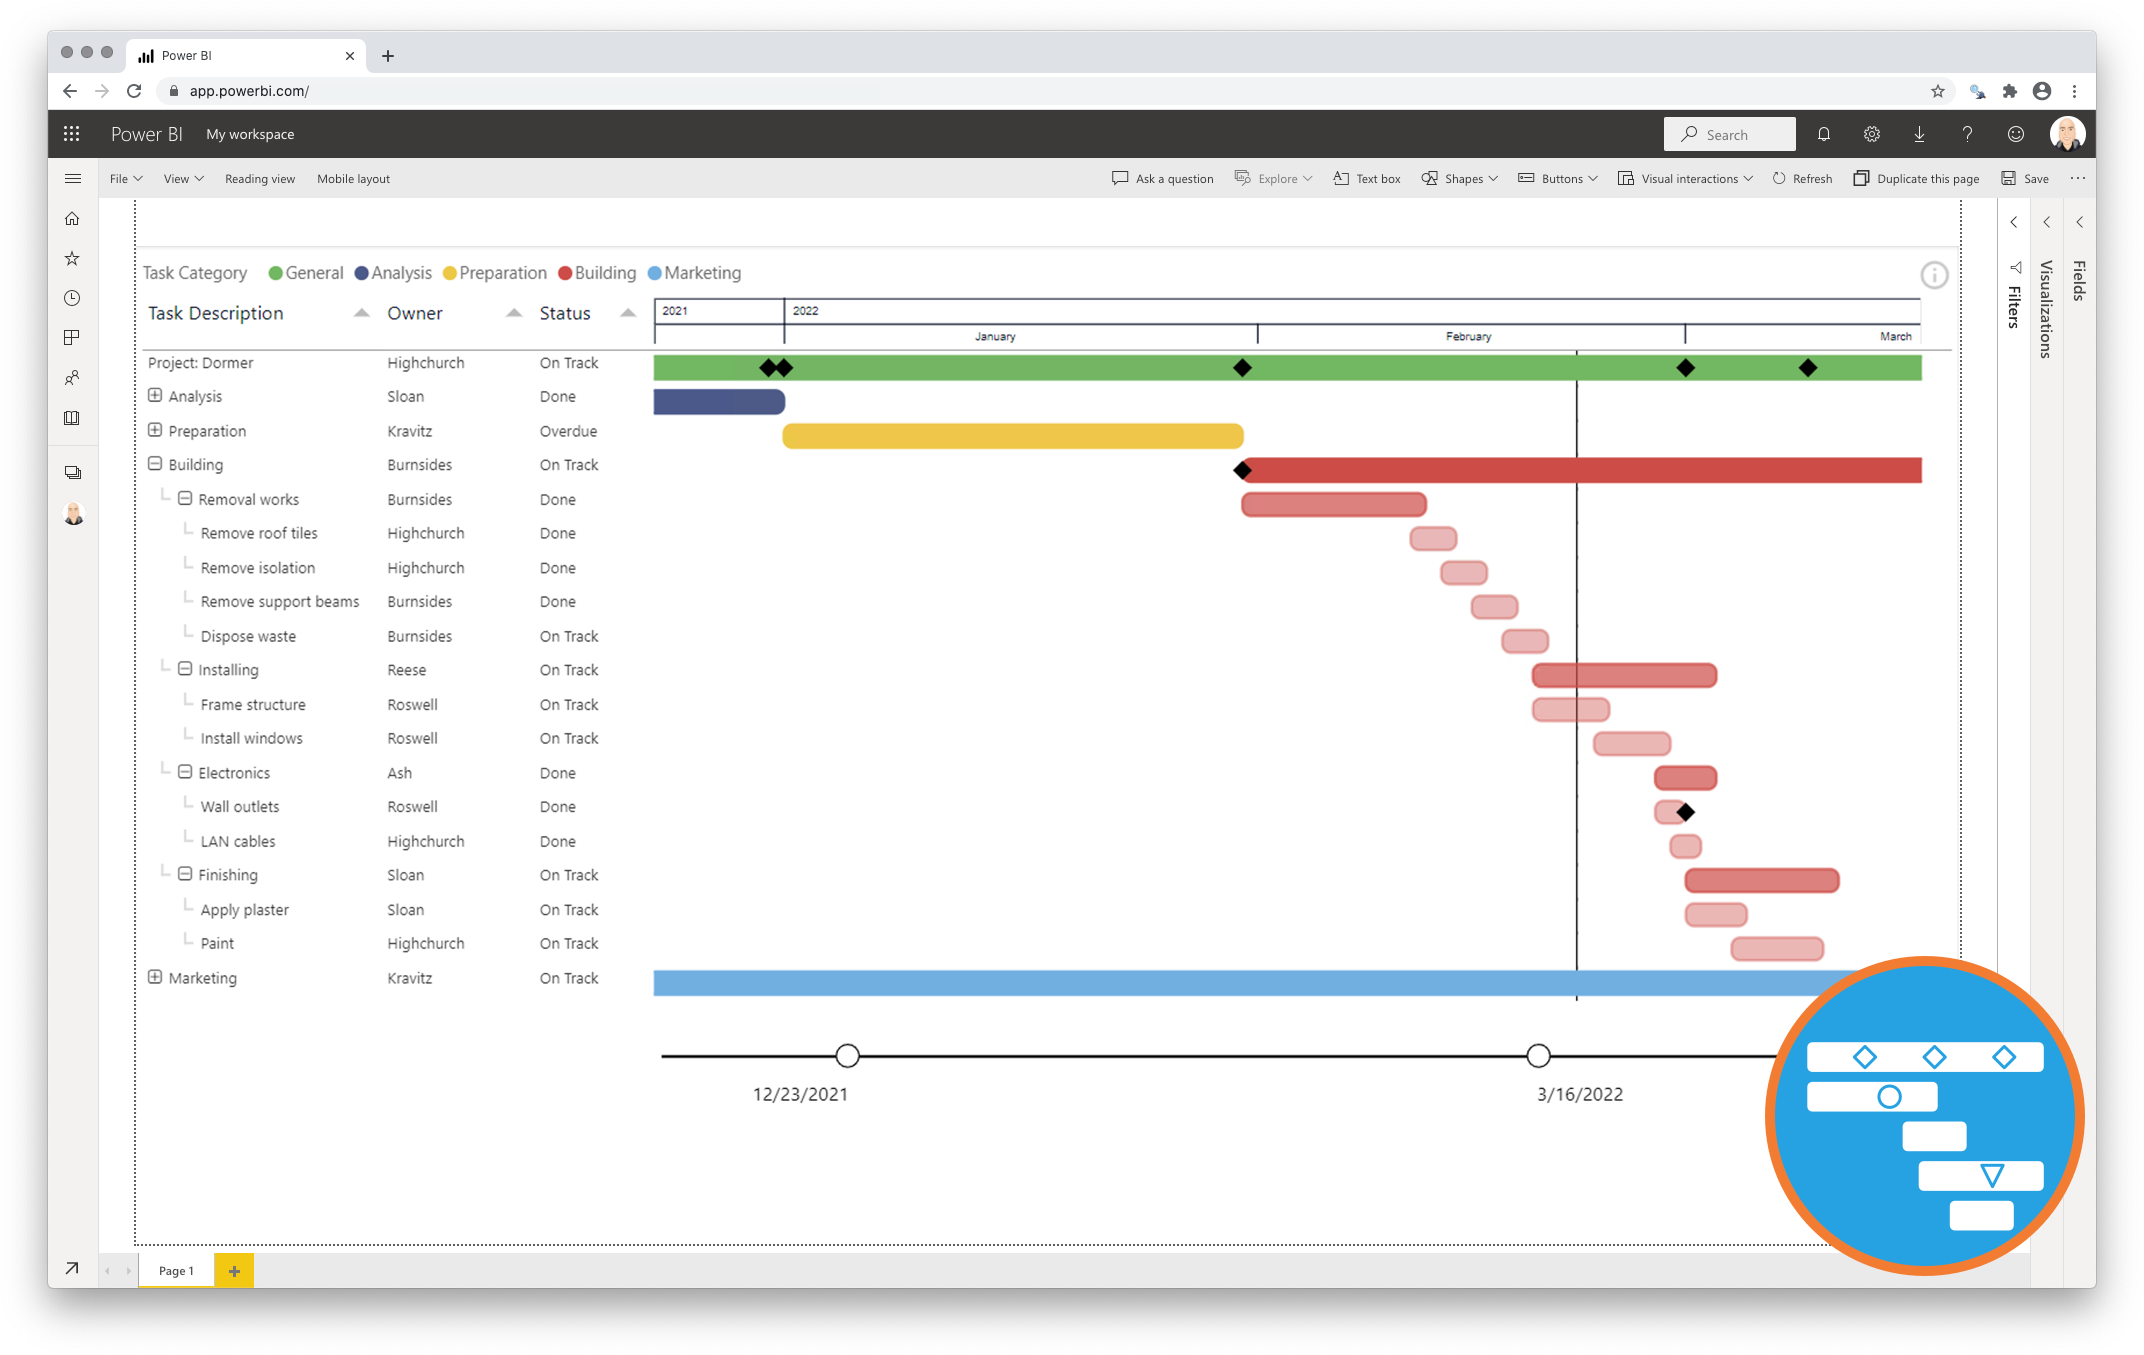
Key features of the Power Gantt Chart

  • Excellent visualization of your program and project schedules: Get a high level overview at first, but dive into details using the collapse/expand buttons. Zoom into specific periods using the zoom slider;
  • Progress bars help you to indicate the progress and status of individual tasks;
  • Unlimited number of tasks, hierarchy levels and milestones: Add as many items as you like to your chart, so you’ll never have to omit any details to your chart;
  • Highly customisable: Add or remove columns, change colors of bars based on your own criteria, or change the date granularity;
  • Formatting options are in line with the options you know from the Power BI Line Chart, so no need to learn a new interface. And of course, theme colors and settings are supported;
  • Improved tooltip support: Create independent tooltips for tasks and for milestones to show exactly the data you want.

Watch the video tutorial of the Power Gantt Chart for Power BI HERE. Do you want to try the Power Gantt Chart yourself? Download it from the Microsoft AppSource for free.

2 reviews for Power Gantt Chart for Power BI

  1. bOb

    I like this app because I was able to recreate an Excel project in PowerGantt within 20 minutes. It did exceed my expectations because it enabled several other facets of data that I was not aware of and the ability to drill-down to data through the chart.

  2. Karolis

    We were looking for a gantt chart which is able to display planned steps for construction works per project. For that we have a big table comming from a database including steps, start dates, end dates, responsible persons / employees etc. I have tried out some of the gantt charts available in the marketplace (so that I can compare this to other gantt charts), including the default one from Microsoft which is really weak. This one does pretty much everything that we needed in our case. As a result we now have a planning tool for our construction site managers – they can see on project level which construction steps are done, due or which steps have any issues and who is responsible for the step. I also like the simple licencing model (per creator), please keep it as this is an advantage compared to other gantt charts out there.

    One issue that we do have with this gantt chart (please fix it) is that when sending automatic report snapshots via Subscription, in the email the snapshot of the report is empty. So we can only add the link to the report, but not the snapshot / screenshot of the current view.

    Thanks
    Karolis

Add a review

Your email address will not be published. Required fields are marked *

You may also like…