Introduction: Milestone Trend Analysis
Effective and clean supervision of your project progress
In every medium to large project there is a set of milestones. Milestones are critical moments during a project that are used to mark project progress. But we also know the dates of these milestones can change: some are brought forward and some get delayed.
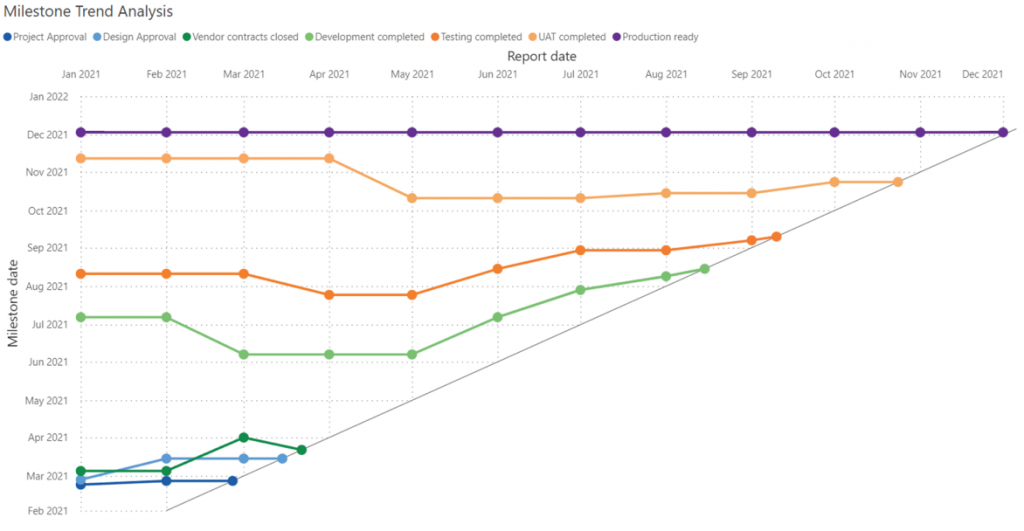
These changes in milestone dates are early warning signals of challenges in your project progress. The Milestone Trend Analysis Chart for Power BI gives every project manager a clear overview of these changes. It visualizes what is and is not working in the project and helps signal issues with the project scope.
Key features of the Milestone Trend Analysis Chart are:
- Visualization of milestone trends: get a clear overview of multiple milestone changes and easily detect the milestones brought forward or delayed;
- Formatting options are in line with the options you know from the Power BI Line chart, so no need to learn a new interface. And of course, theme colors and settings are supported;
- Selection & Highlighting: like in standard Power BI charts you can make use of the Selection & Highlighting functions within the Milestone Trend Analysis Chart;
- Context menu: like in standard Power BI charts you have access to the context menu to include and exclude data points;
- Full Tooltip support: Besides the default Tooltip behavior (show the value of the element you hover) you can also add additional fields to the tooltip;
- Full Bookmark support: like any of the standard visuals the Milestone Trend Analysis Chart supports Bookmarks.
How to use: Build visual
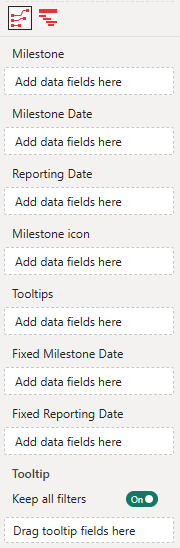
To use the Milestone Trend Analysis Chart, you need to have a dataset with at least a Milestone and two dates: the Reporting Date and the Milestone Date. The available buckets are:
- Milestone: This is the name of each Milestone as it is displayed in the legend.
- Milestone Date: The expected delivery date of the Milestone on the reporting date. This date is used for the position on the y-axis. Make sure this field is a Date field.
- Reporting Date: The date the expected delivery date is reported. This date is used for the position on the x-axis. Make sure this field is a Date field.
- Milestone icon: Add a category to show image URLs for SVG, PNG, JPG, and GIF formats. Icons need to be provided as Base64-encoded images, including the necessary Meta-Data header. SVG images can use
currentColorfor fill and border, allowing the icons to dynamically adapt to milestone color settings. For more information see Tutorial: Adding custom icons to Milestones. - Tooltips: The fields added here will show in the tooltip when the user hovers over a specific line marker. If multiple milestones are on the same point, they all will be visible in the tooltip.
- Fixed Milestone Date: Vertical (y) axis. Add two parameters (a minimum and maximum date) to define its range. The corresponding axis will then be fixed according to these selected dates. Make sure this field is a Date field.
- Fixed Reporting Date: Horizontal (x) axis. Add two parameters (a minimum and maximum date) to define its range. The corresponding axis will then be fixed according to these selected dates. Make sure this field is a Date field.
How to use: Format visual
The Visual specific settings contain formatting properties that allow you to change the default behavior of the visual, besides the standard format sections there are a number of additional format sections that allow you to change the behavior of this visual:
- License: here you can enter your PREMIUM license information to disable any license reminders.
- Milestones: you can change the standard colors of each of the milestone lines, and change the shapes per line. There are 7 different shapes available. Options available:
- Stacked Milestones: by default off. This option is available if you have multiple milestones with the same milestone date and reporting date. Set it on to display a heavy asterisk shape, it will allow users to quickly spot projects with multiple milestones on the same date. Hover over the stacked milestones shape to see a tooltip with all the milestones names. Additionally, you can customize the color of the stacked milestones shape.
- Apply settings to: select the column you want to format from the drop-down menu.
- Color: change the color of the milestone lines and shapes.
- Shape: change the shape of the milestones.
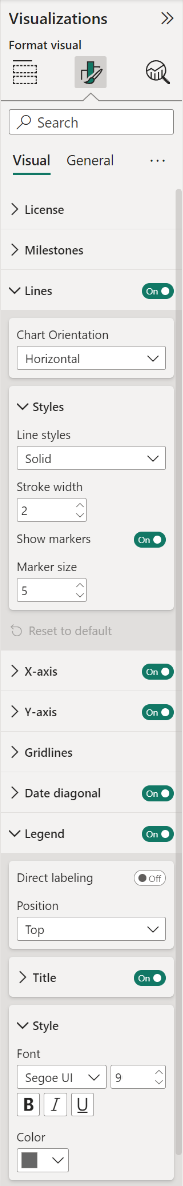
- Lines: these options allow you to change the chart orientation and visual style of all the milestone lines.
- Chart Orientation: Horizontal (default), Vertical.
- Styles: Line styles (Dashed, Solid, Dotted), Stroke width, Show markers (On/ Off), Marker size.
- X-Axis: the formatting options for the x-axis (Reporting Date axis) are similar to the options available within the Line Chart (standard Power BI visual). These familiar options allow you to change the visibility and formatting of the x-axis elements (like: color, title, labels, etc.). Here you can set the Date type, the options range from Year to Second.
- Style: Position (Top, Bottom), Date type (Auto, Second, Minute, Hour, Day, Month, Quarter, Year).
- Values: change the Font family, text Size, emphasized text (Bold, Italic, Underline) and font Color.
- Title: Title text, Font family, text Size, emphasized text (Bold, Italic, Underline) and font Color, Title Position (Align left, center, right) and Title color.
- Y-Axis: the formatting options for the y-axis (Milestone Date axis) are also similar to the options available for the X-Axis. As additional option, you can set the Minimum category width.
- Style: Date type (Auto, Second, Minute, Hour, Day, Month, Quarter, Year), Order (Descending, Ascending).
- Values: change the Font family, text Size, emphasized text (Bold, Italic, Underline), font Color and Minimum category width.
- Title: Title text, Font family, text Size, emphasized text (Bold, Italic, Underline) and Size, Title Position (Align left, center, right) and Title color.
- Gridlines: by default the chart has horizontal and vertical thin and light background lines in the grid.
- Horizontal: turn on/off the horizontal gridlines and set the Style (Dashed, Solid, Dotted), the Color and Width.
- Vertical: turn on/off the vertical gridlines and set the Style (Dashed, Solid, Dotted), the Color and Width.
- Date diagonal: the formatting settings of the diagonal line on the same Reporting and Milestone Dates. This includes Line style (Dashed, Solid, Dotted), Color and stroke Width.
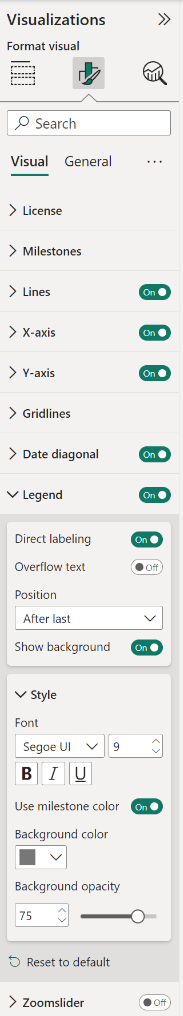
- Legend: Show/hide the legend by clicking the toggle on/off. Available options:
- Direct labeling: set on this option to add a label next to the line, this will help you to better identify the different lines.
- Overflow text: if Direct labeling is on, this flag will show all labels (even if they overlap).
- Position: the position of the labels Before first, After first, Before last, After last.
- Show background: if Direct labeling on, this will toggle the label backgrounds.
- Position: the positioning of the legend Top, Bottom, Left, Right, Top Center, Bottom Center, Left Center, Right Center.
- Title: available if Direct labeling is off. Hide/show the legend title or change the Legend name.
- Style: change the Font family, text Size, emphasized text (Bold, Italic, Underline) and Color of the legend labels.
- Use milestone color: if Direct labeling is on, it will pick up the different colors set under the Milestones or switch off to select one default Color for all labels.
- Background color: if both Direct labeling and Show background are on, you can change the color of the label background.
- Background opacity: if both Direct labeling and Show background are on, you can change the opacity of the label background.
- Direct labeling: set on this option to add a label next to the line, this will help you to better identify the different lines.
- Zoomslider: enable the zoomslider option to easily examine a smaller range of the date/time in the MTA chart without having to use a filter. The zoomslider is added on the chart’s x-axis and can be used for horizontal scrolling. Click and drag endpoints on sliders to adjust the dimensions of the chart, slide both endpoints toward the center. The closer the two endpoints are to each other, the more you zoom in to display shorter, finer segments. Click and hold down the left mouse button on the center section of the zoom bar and then scroll left or right to a particular point. Click on the date label to display and select from the Calendar instead. The zoomslider can also be switched off/on. Available formatting subcategories:
- Color: to change the color of the zoomslider (endpoints and line).
- Style: to change the Font family, text Size, emphasized text (Bold, Italic, Underline) and Font color of the zoomslider date labels.
The General settings contain options that affect the visual container and are consistent across all visual types. Here you can also customize the general Title and Tooltips.
How to use: Examples
1: How to change axis orientation
In the Milestone Trend Analysis Chart, by default, the x-axis represents the reporting date, while the y-axis displays the milestone date. Each milestone is marked as a data point, with the horizontal connecting lines to show their progression over time.
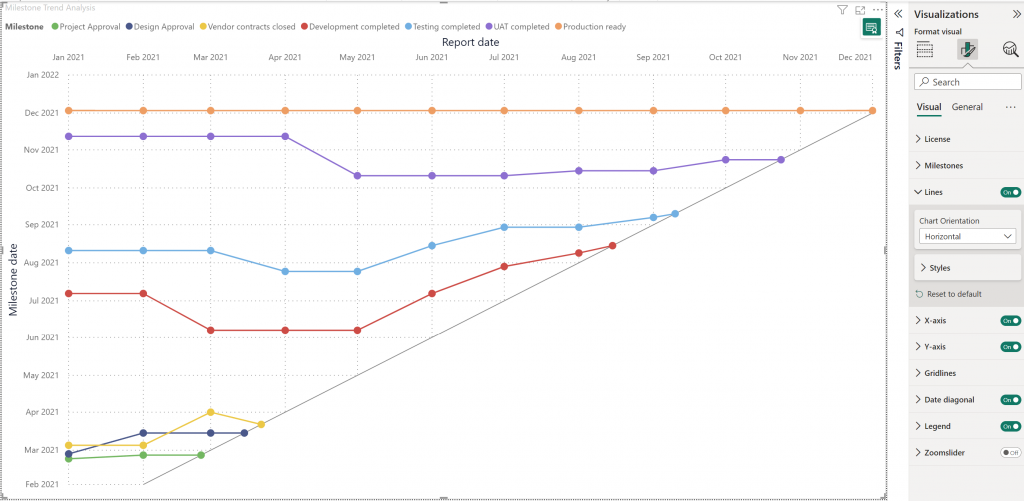
Sometimes it is easier for users to see the progression of milestones over time when changing the orientation to a vertical axis. To change the Chart Orientation:
- Open Power BI Desktop or Service
- Click on the Milestone Trend Analysis Chart
- Go to Format visual > Visual > Lines > Chart Orientation
- Choose Vertical from the drop-down menu
- Save and Publish to the Power BI Service.
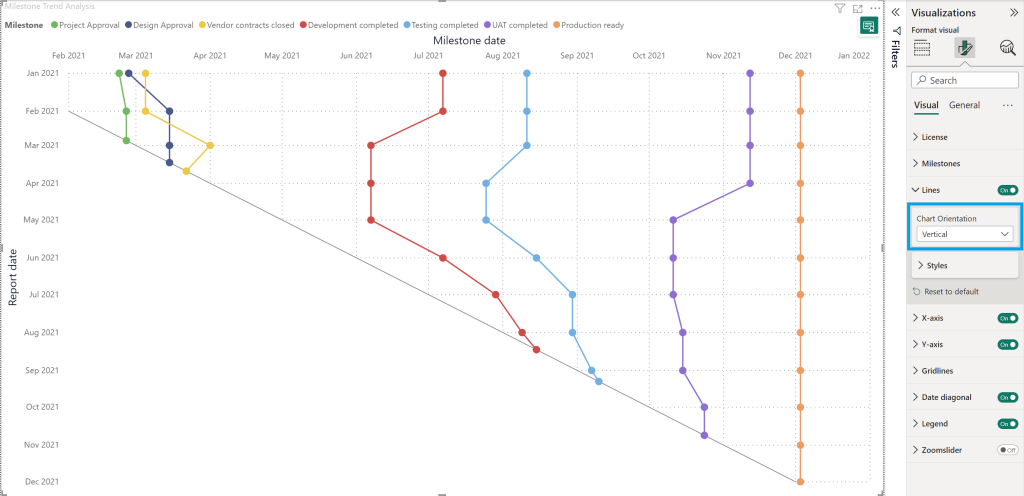
The vertical axis orientation provides a top to bottom reporting date, this will help you to easily identify the trends and deviations of your milestones.
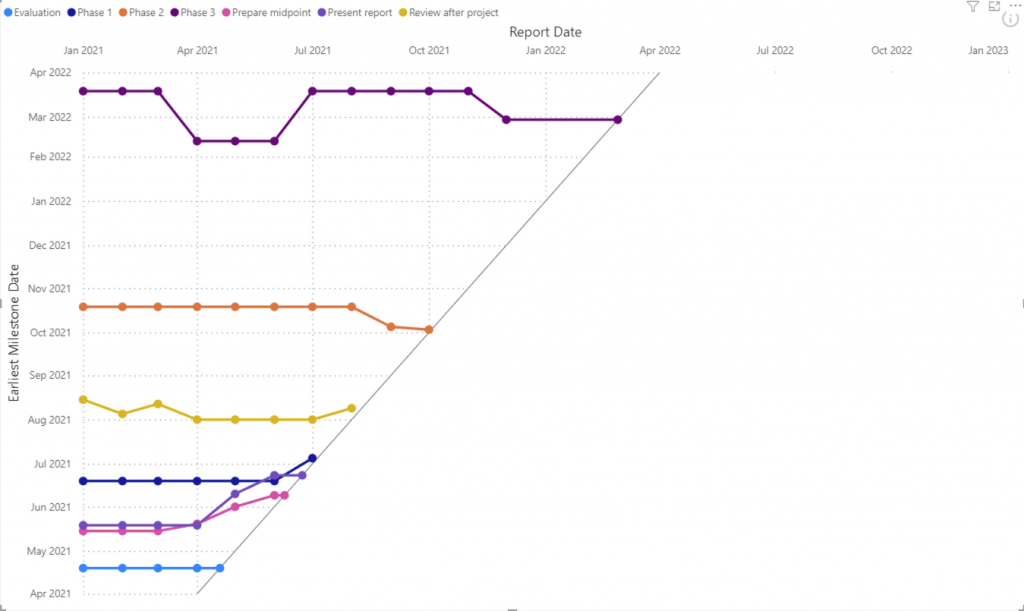
2: How to show a report date in the future
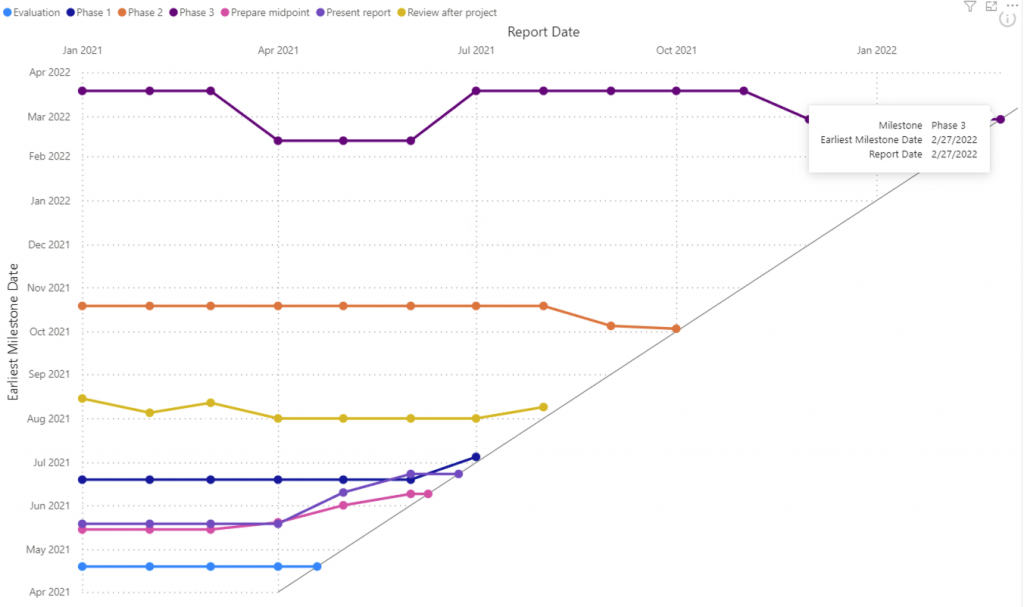
The Milestone Trend Analysis Chart displays only the time range which is covered by the reporting times but not the full time range until all milestones are reached. By default, Power BI will only show the complete rows of data and suppress any incomplete rows.
In the example below, the x-axis (Report Date) shows until the last available date Feb 27, 2022 (2/27/2022).
To change this behavior do the following:
- Add a row with only one Report date to your dataset, this should be the date the Report Date scale will use as the end date (for ex. 31/12/2023).
- Right click on the Reporting Date category (in Build visual) and check the Show items with no data option, to show the incomplete rows.
- To avoid blank values, please ensure that you add the date in the specific column, in this case the Reporting Date. If you add the date to the Milestone Date column, it will return a blank value (in the Legend and visual), which could affect your data analysis.
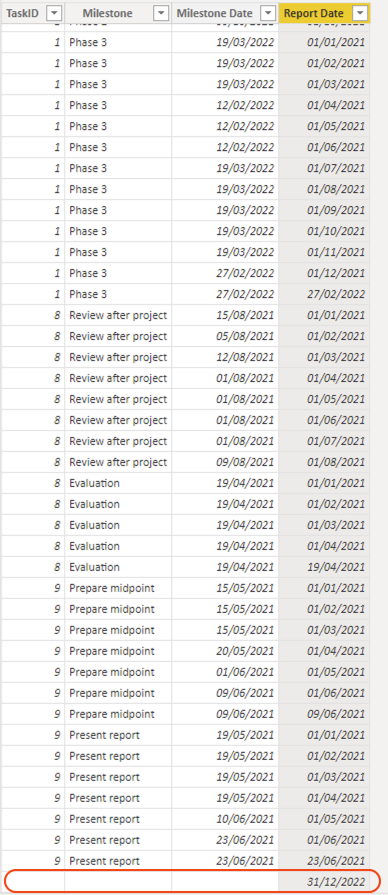
The last date is now that last row with December 31, 2022 included.
3. How to add custom milestone markers
The Milestone Trend Analysis Chart (MTA) now supports custom icons for milestone data points, giving you greater clarity and flexibility in schedule trend reporting.
Custom icons also support conditional formatting, so they can automatically change based on status, category, progress, or any other criteria. This makes it easier to monitor project health quickly and visually.
You can also match icons to your organization’s terminology and branding, creating a more intuitive and consistent tracking experience.
Icons can be added using Base64-encoded image URLs with the required metadata headers. Supported file formats include SVG, PNG, JPG, and GIF. For SVGs, where currentColor was used for fill and border; the icons will automatically adopt the corresponding legend color.
For more information see Tutorial: Adding custom icons to milestones.
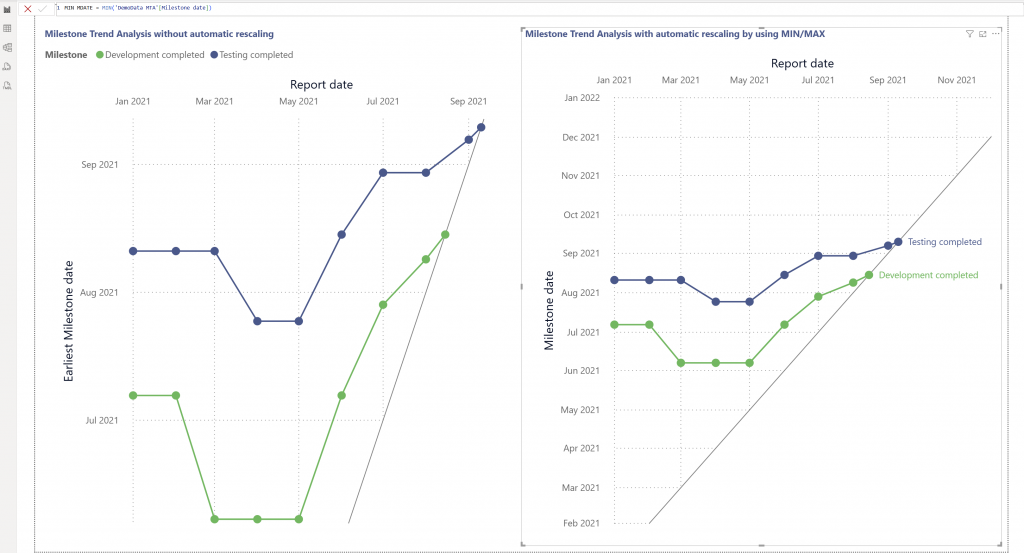
4. How to set automatic rescaling
The MTA visual supports two additional data field wells that allow the Y-axis (Milestone date) and X-axis (Report date) ranges to be fixed.
These two additional data field wells are available in the Build visual pane:
- Fixed Milestone Date — controls the vertical (Y) axis range. Requires a MIN and a MAX date field.
- Fixed Reporting Date — controls the horizontal (X) axis range. Requires a MIN and a MAX date field.
Making the Range Dynamic
To make the fixed axis range, define the MIN/MAX measures to calculate dynamically.
- Create DAX measures for:
MIN Milestone Date: Earliest milestone date. For ex. MIN MDATE = MIN(‘DemoData MTA'[Milestone date])
MAX Milestone Date: Latest milestone date. For ex. MAX MDATE = MAX(‘DemoData MTA'[Milestone date])
MIN Reporting Date: Earliest reporting date. For ex. MIN RDATE = MIN(‘DemoData MTA'[Report date])
MAX Reporting Date: Latest reporting date. For ex. MAX RDATE = MAX(‘DemoData MTA'[Report date]) - Open the Build pane in Power BI Desktop.
- Add your MIN and MAX Milestone Date measures to the Fixed Milestone Date well.
- Add your MIN and MAX Report Date measures to the Fixed Reporting Date well.
- Save and publish the report. Apply filter interactions, the axes should now remain fixed.
For any questions or remarks about this Visual, please contact us by email at Nova Silva Support, or visit the Community forums.