Tutorial: Setting up Drill through
Drill through works in our visuals as in any standard Power BI visual.
Drill through in Power BI allows you to explore in visuals additional details related to a specific category. By setting up Drill through, you can define specific fields and go automatically from the main page to another page to show information of the item you drilled from. You can set up drill through in your reports in Power BI Desktop or Service.
There are two ways to drill through a report:
- Right-click on a category in the visual (see Adding a drill through page)
- Click on a drill through button (see Adding a drill through button)
Try it yourself!
Here’s what you need to set up Drill through:
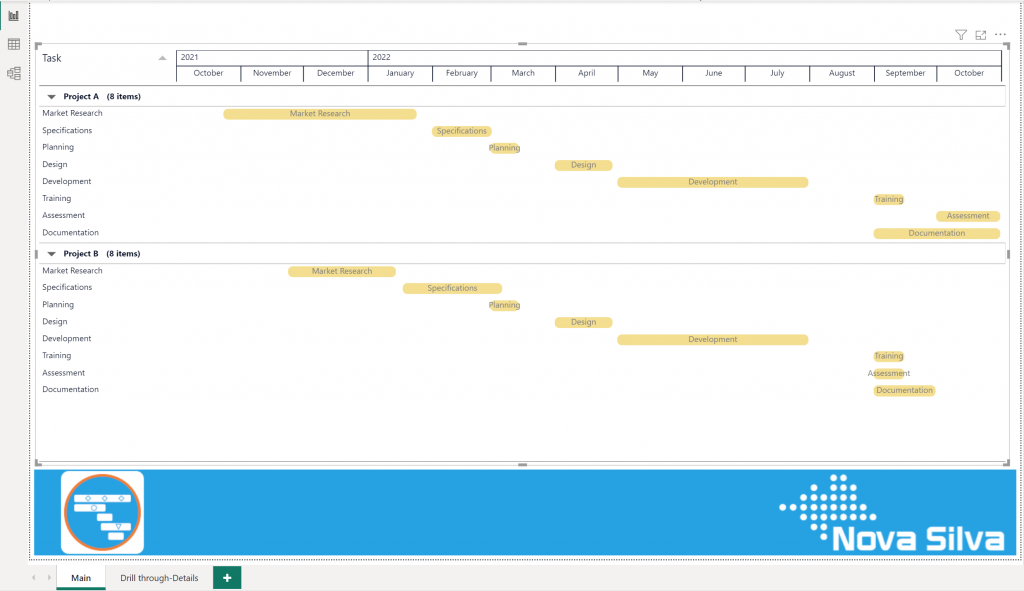
– a Power BI report with a main page (source) and any type of Nova Silva visual(s)
– a second page (target) with a Power BI visual or another Nova Silva visual
Note that for drill through to work in Power BI Service the Nova Silva visual needs to be licensed.
Adding a drill through page
You can add a drill through page in your Power BI reports. This page displays additional details and visuals for specific data points and categories.
Follow these steps to add a Drill through page:
- Create or open a Power BI report in Power BI Desktop
- Add a main ‘source’ page with visual(s)
- Click on the ‘+’ icon to add another New page (to create a blank ‘drill-through target page’)
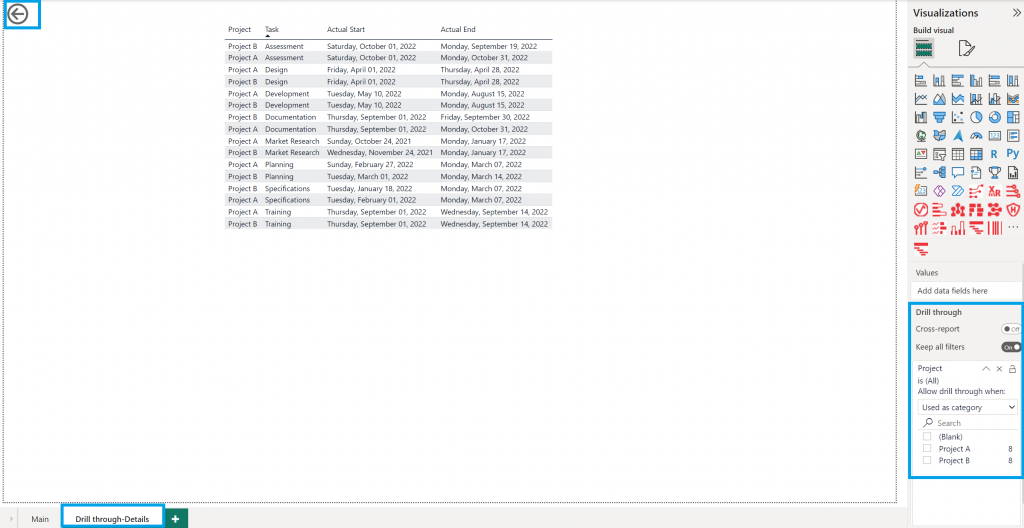
- Rename the new ‘target’ page (for example “Drill through-Details”)
- Add visual(s) that help users to do deeper analysis
- Add a category to the Add drill-through filters here on that target page (a back button is automatically added)
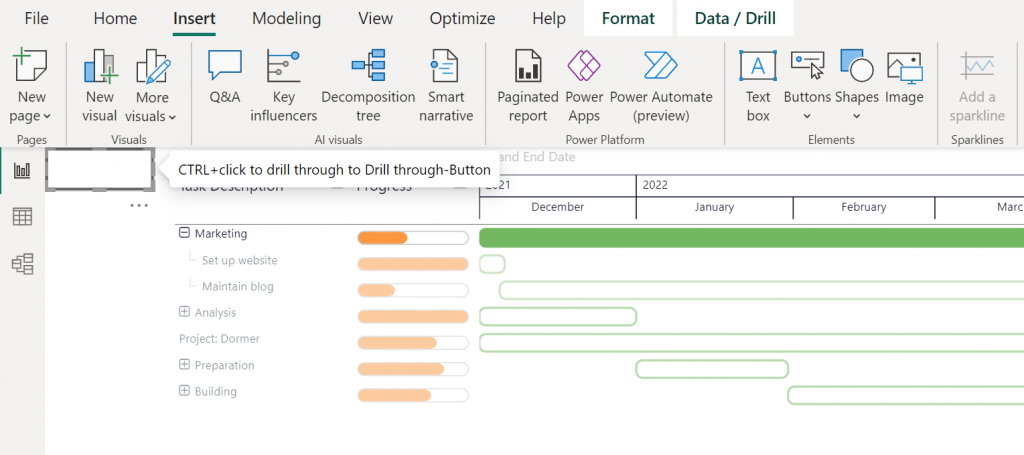
- Test the Drill through by clicking CTRL+click on the back button to get back to the original source report page
In the source page right-click on an item in the visual and then click on Drill through > Drill through-Details
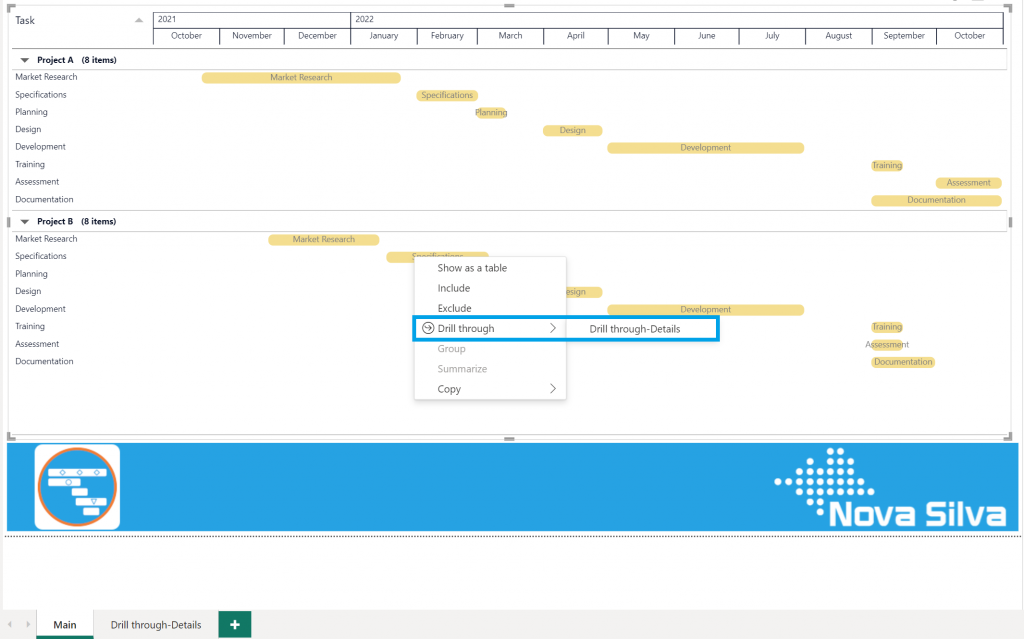
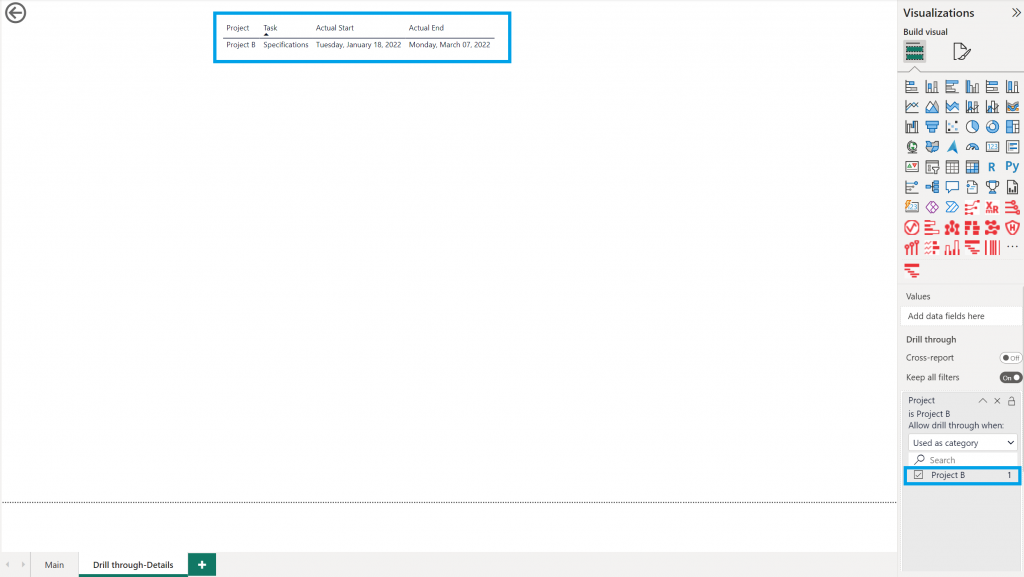
You will navigate to the additional details of the selected item.
Power BI Desktop and Service in Edit mode allows only CTRL+click on drill through buttons.
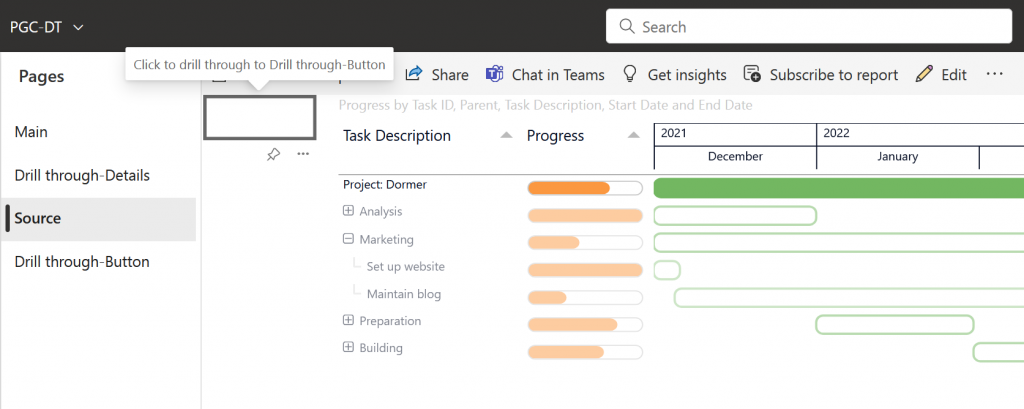
Power BI Service in View mode supports one-click drill through.
After setting up and testing the Drill through, save the report in Power BI Desktop and publish it to the Service.
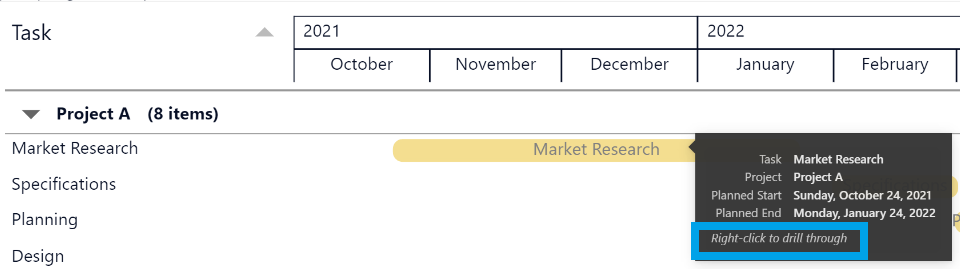
When users hover over the data points in the source page, they will see in the tooltip if the Drill through functionality is available. They can then right-click and choose the Drill through defined. Power BI will navigate the user to the Drill through page, displaying the additional details and visuals associated with the selected data point or category.
Adding a drill through button
You can set up a Drill through button in Power BI. This button drills through to a page with details that are filtered to a specific context.
- Create or open a Power BI report in Power BI Desktop
- Add a main ‘source’ page with visual(s)
- Set up a Drill through ‘target’ page within your report (see Adding a drill through page)
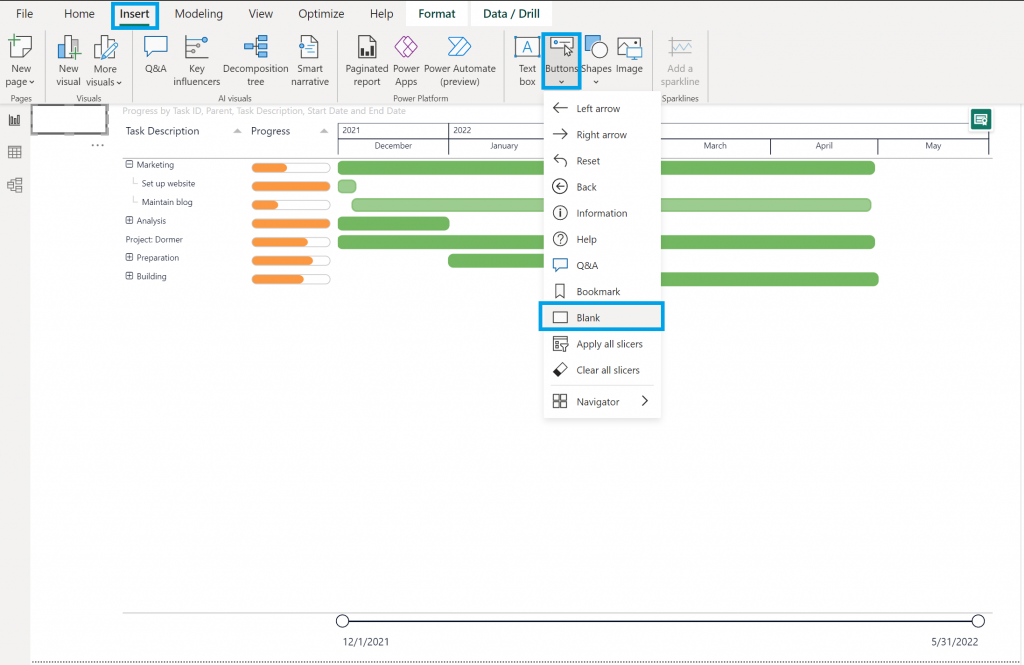
- Add a button to your ‘source’ page by clicking Insert > Buttons > Blank
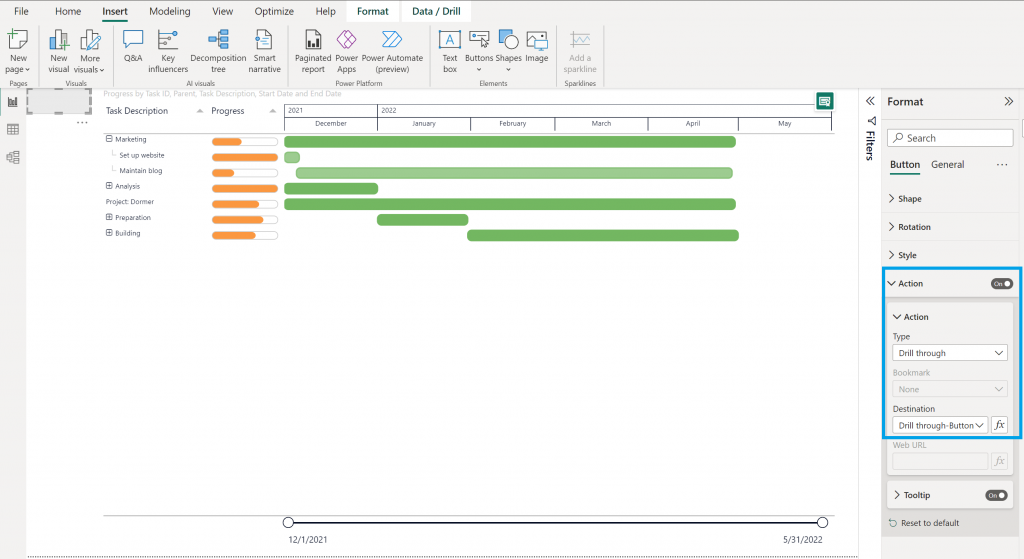
- Select the button and in Format set Action On
- Select Type > Drill through in the Action format card
- Select the drill through page you set up as the Destination
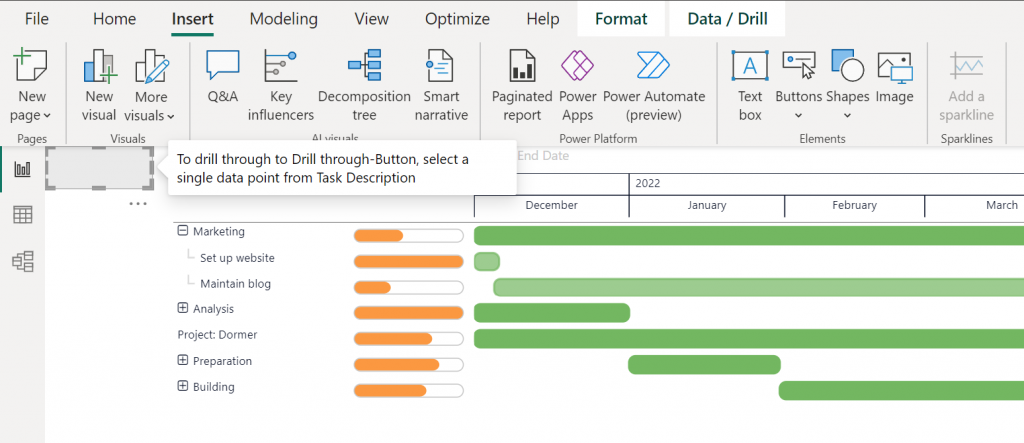
- Test the Drill through by hovering over the button, it will prompt you to select a data point, select and do CTRL+click on the button to get to the target/ destination report page
- Save the report in Power BI Desktop
- Publish to the Power BI Service
Tips for report creators
Rename your target page as Drill through or DT + the name of category used for the drill through, this will help to find the drill through pages when you need to update reports.
Hide your drill through pages so report viewers can only navigate to the target pages via the drill through function/buttons and not by selecting the page.
Customize Tooltips
If you leave the tooltips boxes blank, Power BI automatically generates tooltips. Those tooltips are based on the destination and drill through fields.
You can add your own tooltip strings in the Tooltip format card under Action. You can also apply conditional formatting to tooltips.
Customize drill through buttons
You can customize the formatting options for the disabled state of drill through buttons. For more information, see Microsoft article Customize formatting for disabled buttons.
You can also customize the drill through button. For more information, see Microsoft article Customize buttons in Power BI reports.
CTRL+click drill through in Power BI Desktop and Service in Edit mode
One-click drill through in Power BI Service in View mode
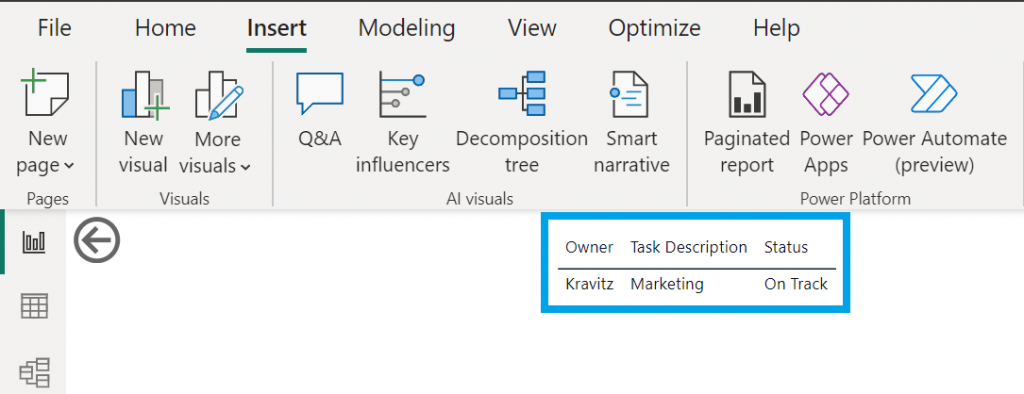
You will navigate to the additional details of the selected item
Conditionally drill through button
Users can drill through conditionally with the help of a button. For example, we want to see the status of the projects without having to do a right-click on each item and navigate to the destination page. This is possible using a ‘conditionally drill through’ action.
- Select the drill through button
- Enable Text under the Style format card
- Click fx under Text and add the category (in this example “Status”)
- Enable Fill under Style format card
- Click fx under Color
- Select Rules
- Add the rules (text and corresponding color) for the available “status” and click OK
- Click on the item
The button will change color according to the status of the project: Red if Overdue, Yellow if On Track and Green if Done.
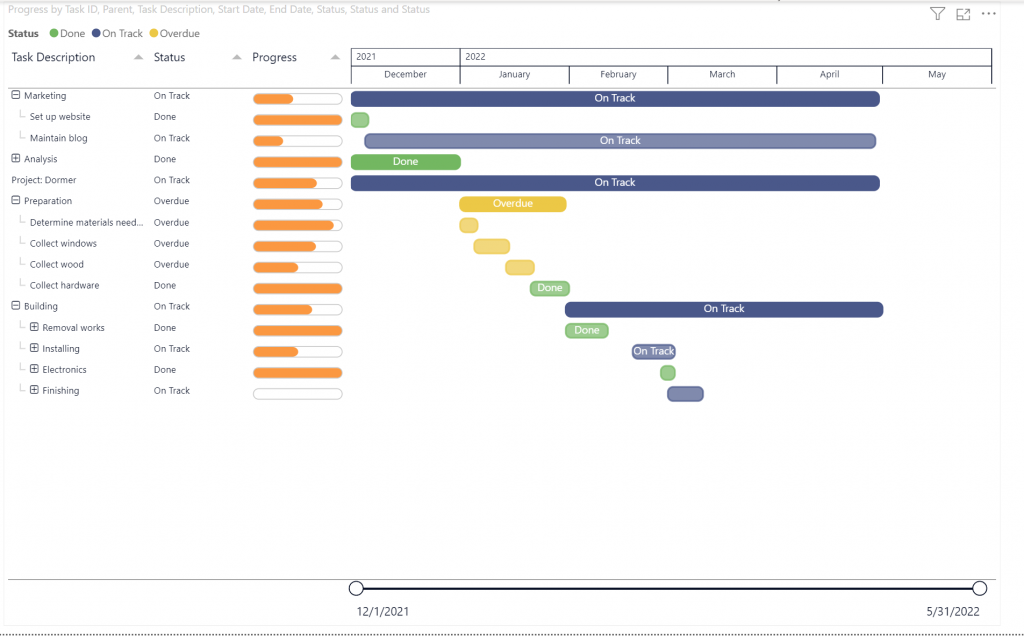
The scenario given above is just an example of the possibilities of conditional formatting in Drill through. In our PowerGantt Chart (if the status is setup in the dataset) users can see the status of their projects by adding the category as a Legend, as Additional columns or as Labels.
Considerations and limitations
- The drill through button doesn’t allow multiple destinations by using a single button.
- This button only supports drill through within the same report; in other words, it doesn’t support cross-report drill through.
- The disabled state formatting for the button is tied to the color classes in your report theme.
- The drill through action works for all built-in visuals and some visuals imported from AppSource. However, it isn’t guaranteed to work with all visuals imported from AppSource.
source: Microsoft Documentation