

Power BI Visuals
PowerGantt Chart
Powerful insight into your planning and milestone performance
The Gantt chart is an excellent tool to visualize your program and project schedules and task dependencies. In the basis, it is a bar chart with tasks or activities on the vertical axis. The horizontal bars show for each task/activity the period between the start and end date (or time). Another important feature of the Gantt chart is that icons can be used to represent milestones: important moments within your project timeline.
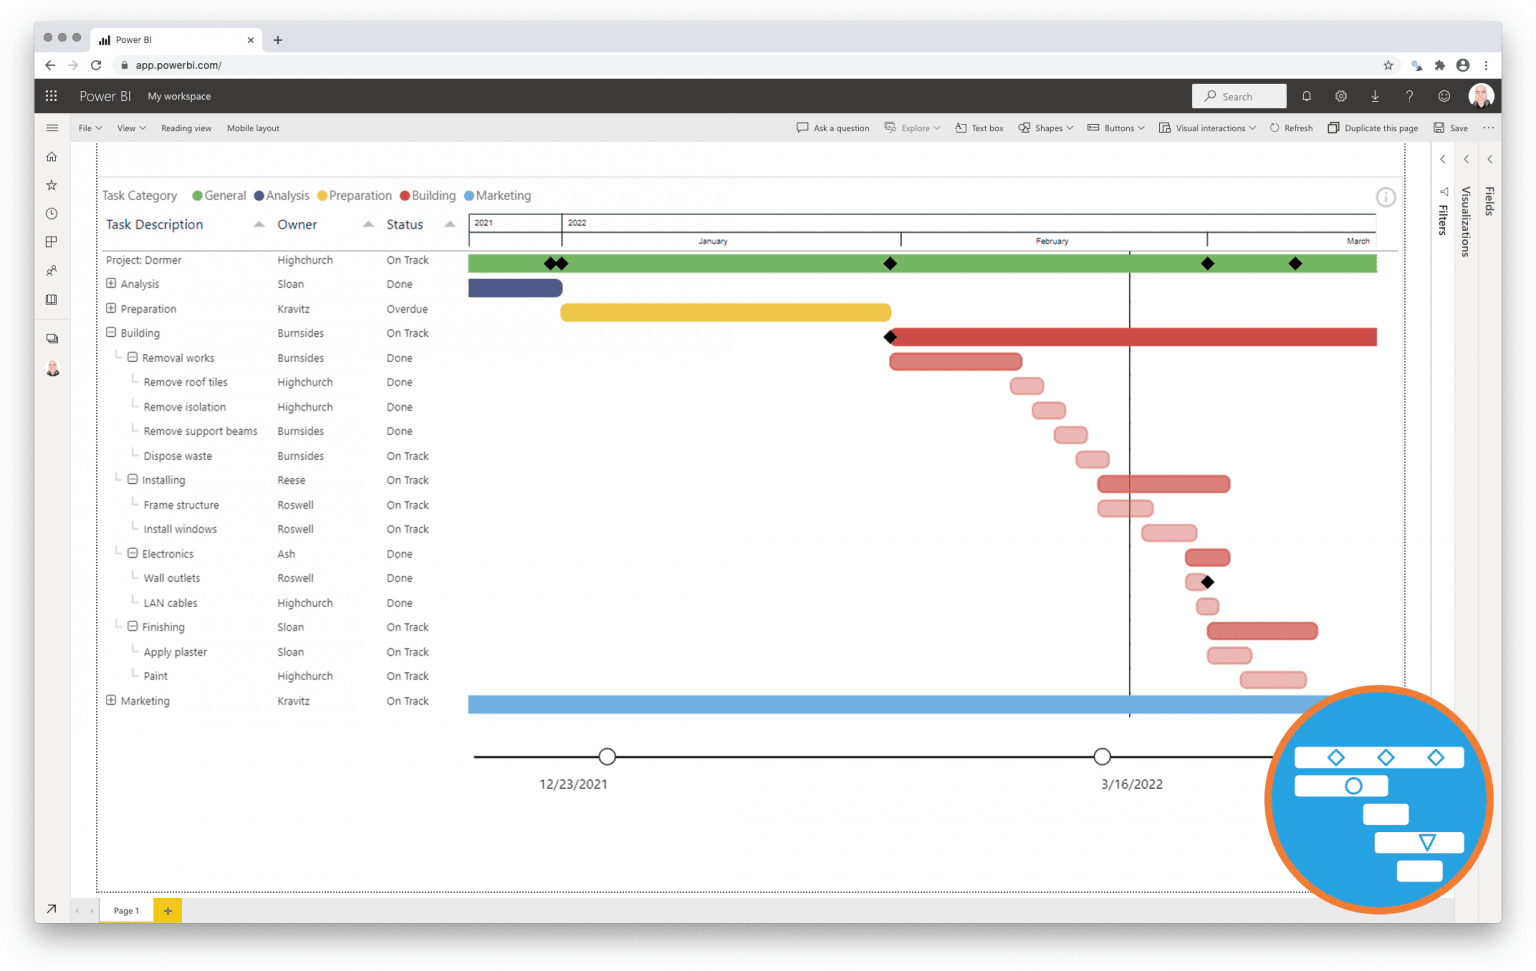
The PowerGantt Chart for Power BI allows you to review both tasks/activities and milestones right in your Power BI reports. The PowerGantt Chart supports unlimited number of task/activities, hierarchy levels and milestones.
One year license within one Power BI Fabric F32 Capacity or smaller including support for unlimited number of users
€ 2.820