

Power BI Visuals
PowerFin Matrix
Build financial statements in Power BI exactly as you publish them
Financial statements — the profit & loss statement, the balance sheet and the cash flow statement — are among the most rigorously formatted reports a finance team produces. They have a fixed line order, custom subtotal names like Gross Profit, EBITDA or Net Result, accounting-style sign conventions, and per-row formatting that is read at a glance by stakeholders, auditors and boards.
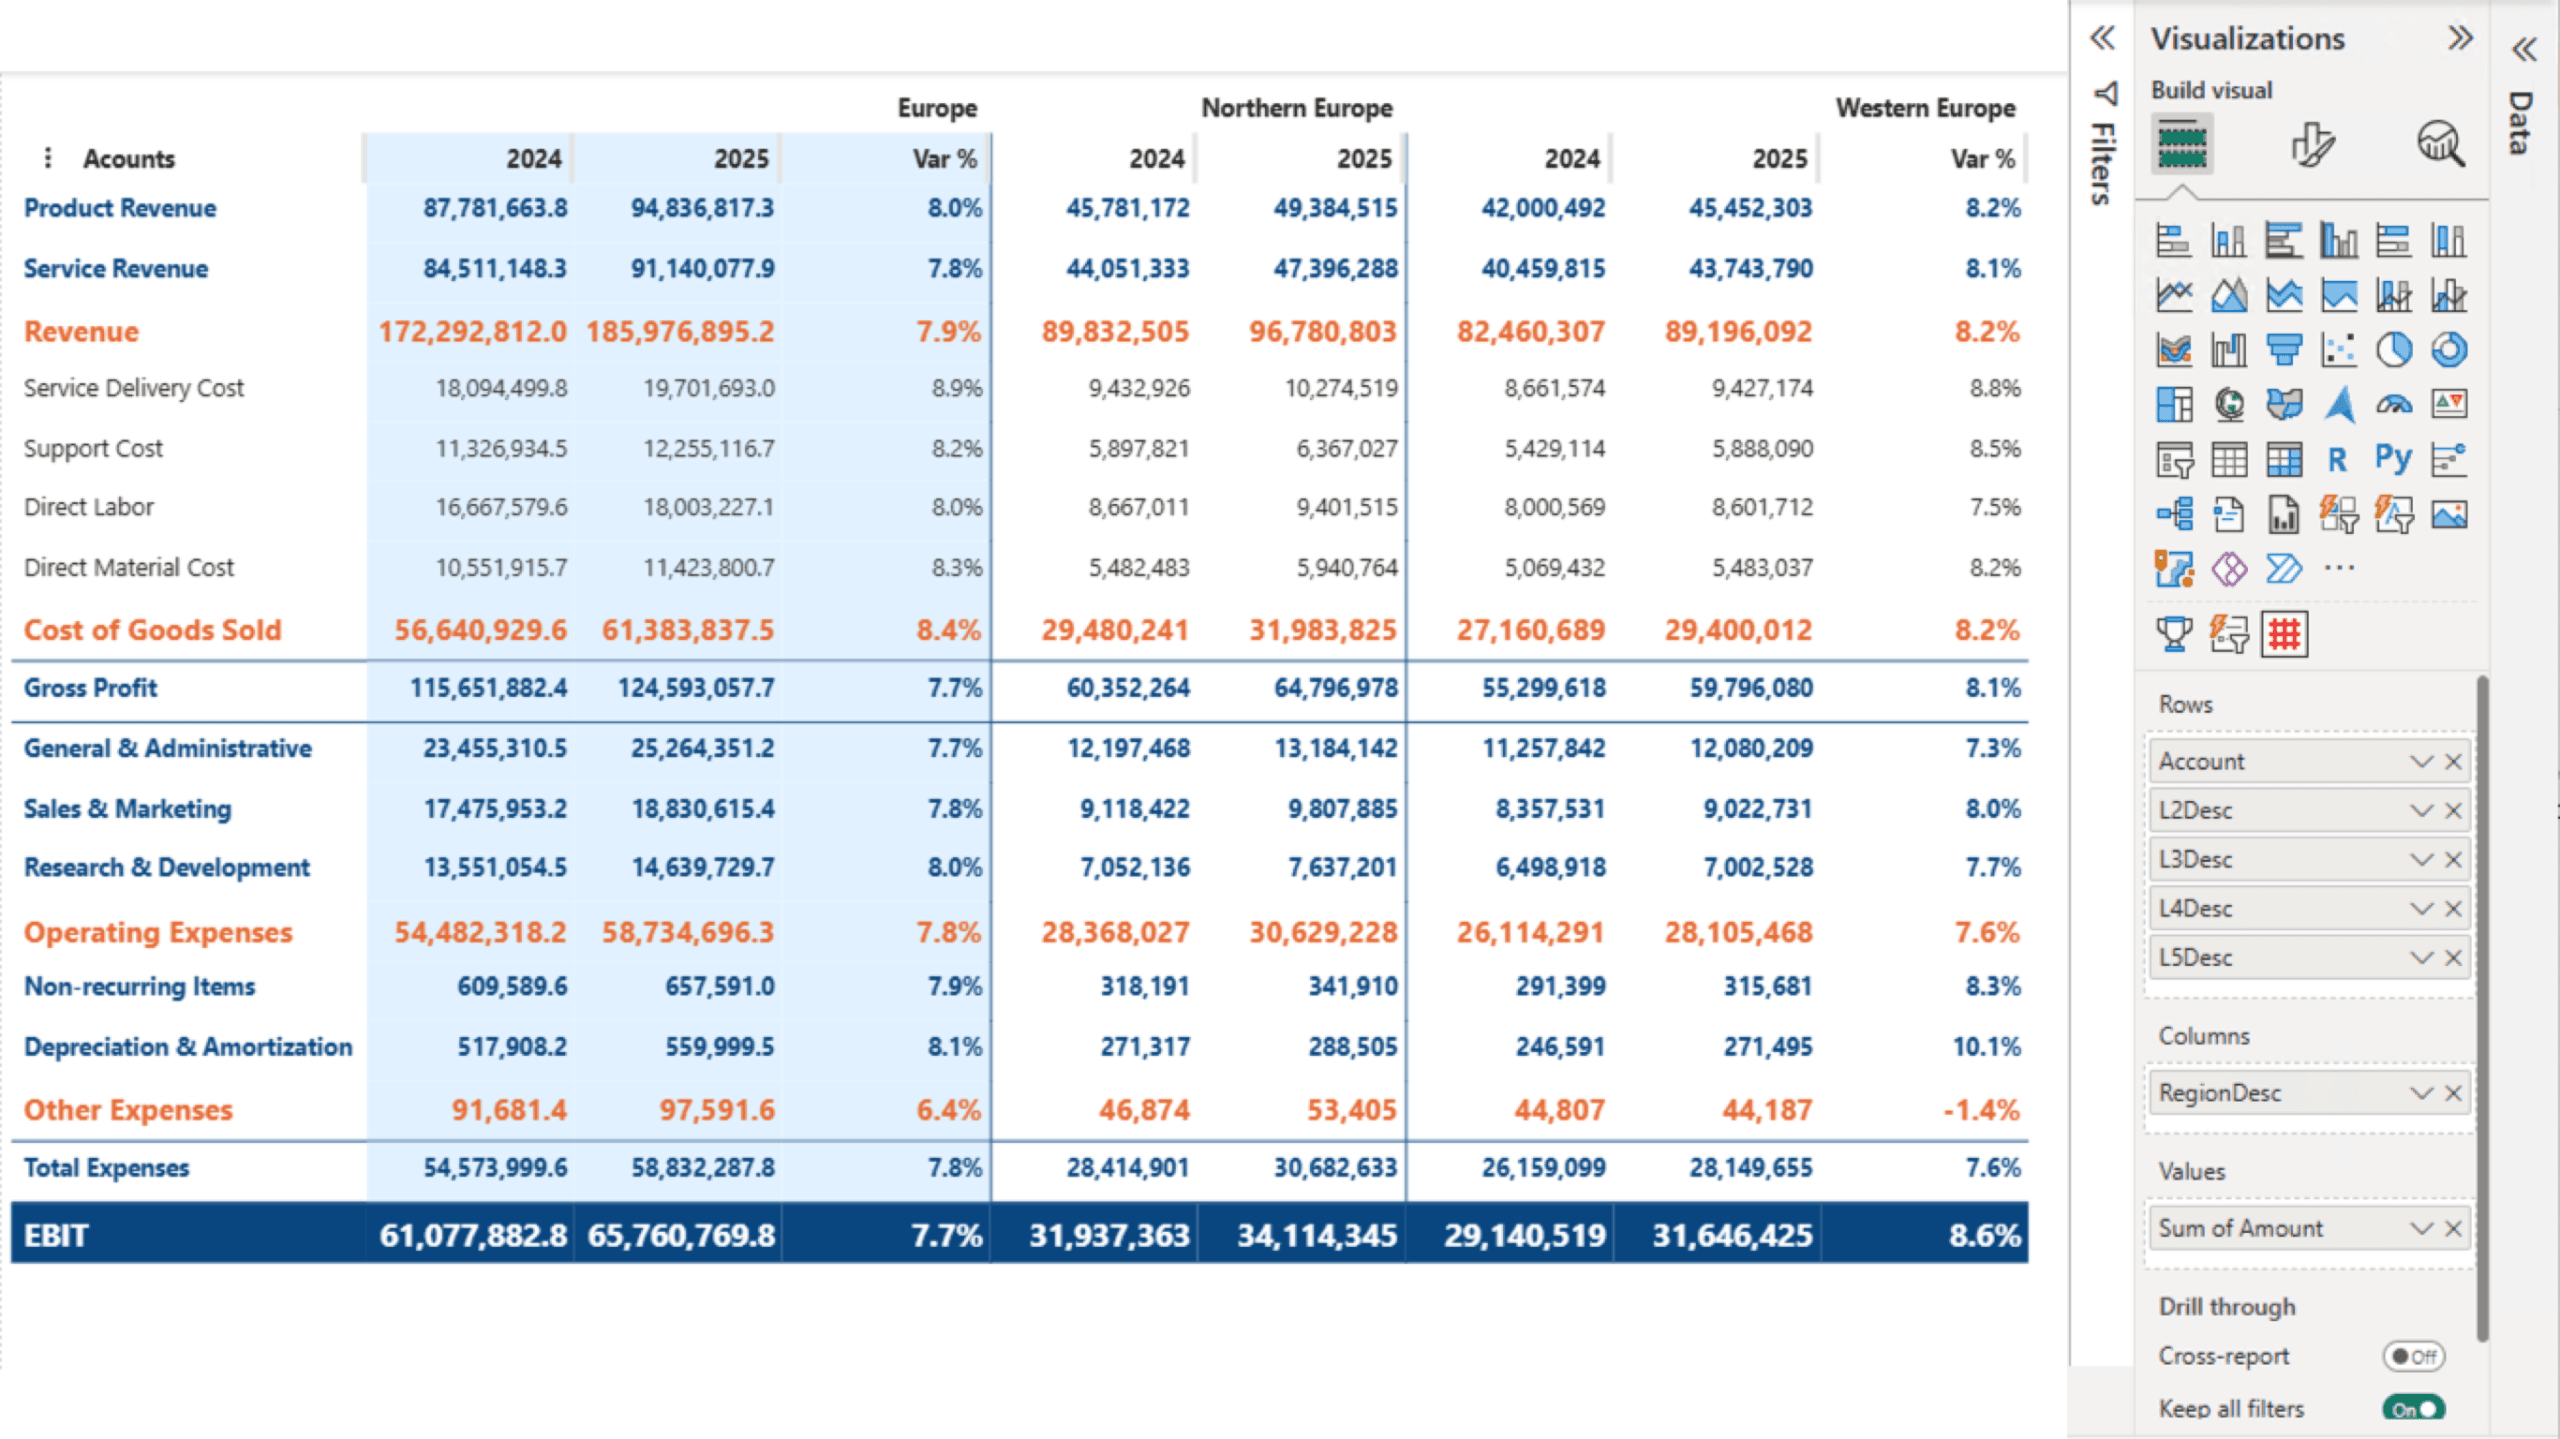
The standard matrix in Power BI was designed for general aggregation. It places subtotals at the top of their details, labels them all “Total”, repeats the same columns underneath every group, and offers limited control over the look of individual rows or cells. Reproducing a published financial statement inside this matrix is at best a workaround — and often forces finance teams back into Excel.
One year license within one Power BI Fabric F32 Capacity or smaller including support for unlimited number of users
€ 1.860