
← Continue shopping 
Power BI Visuals
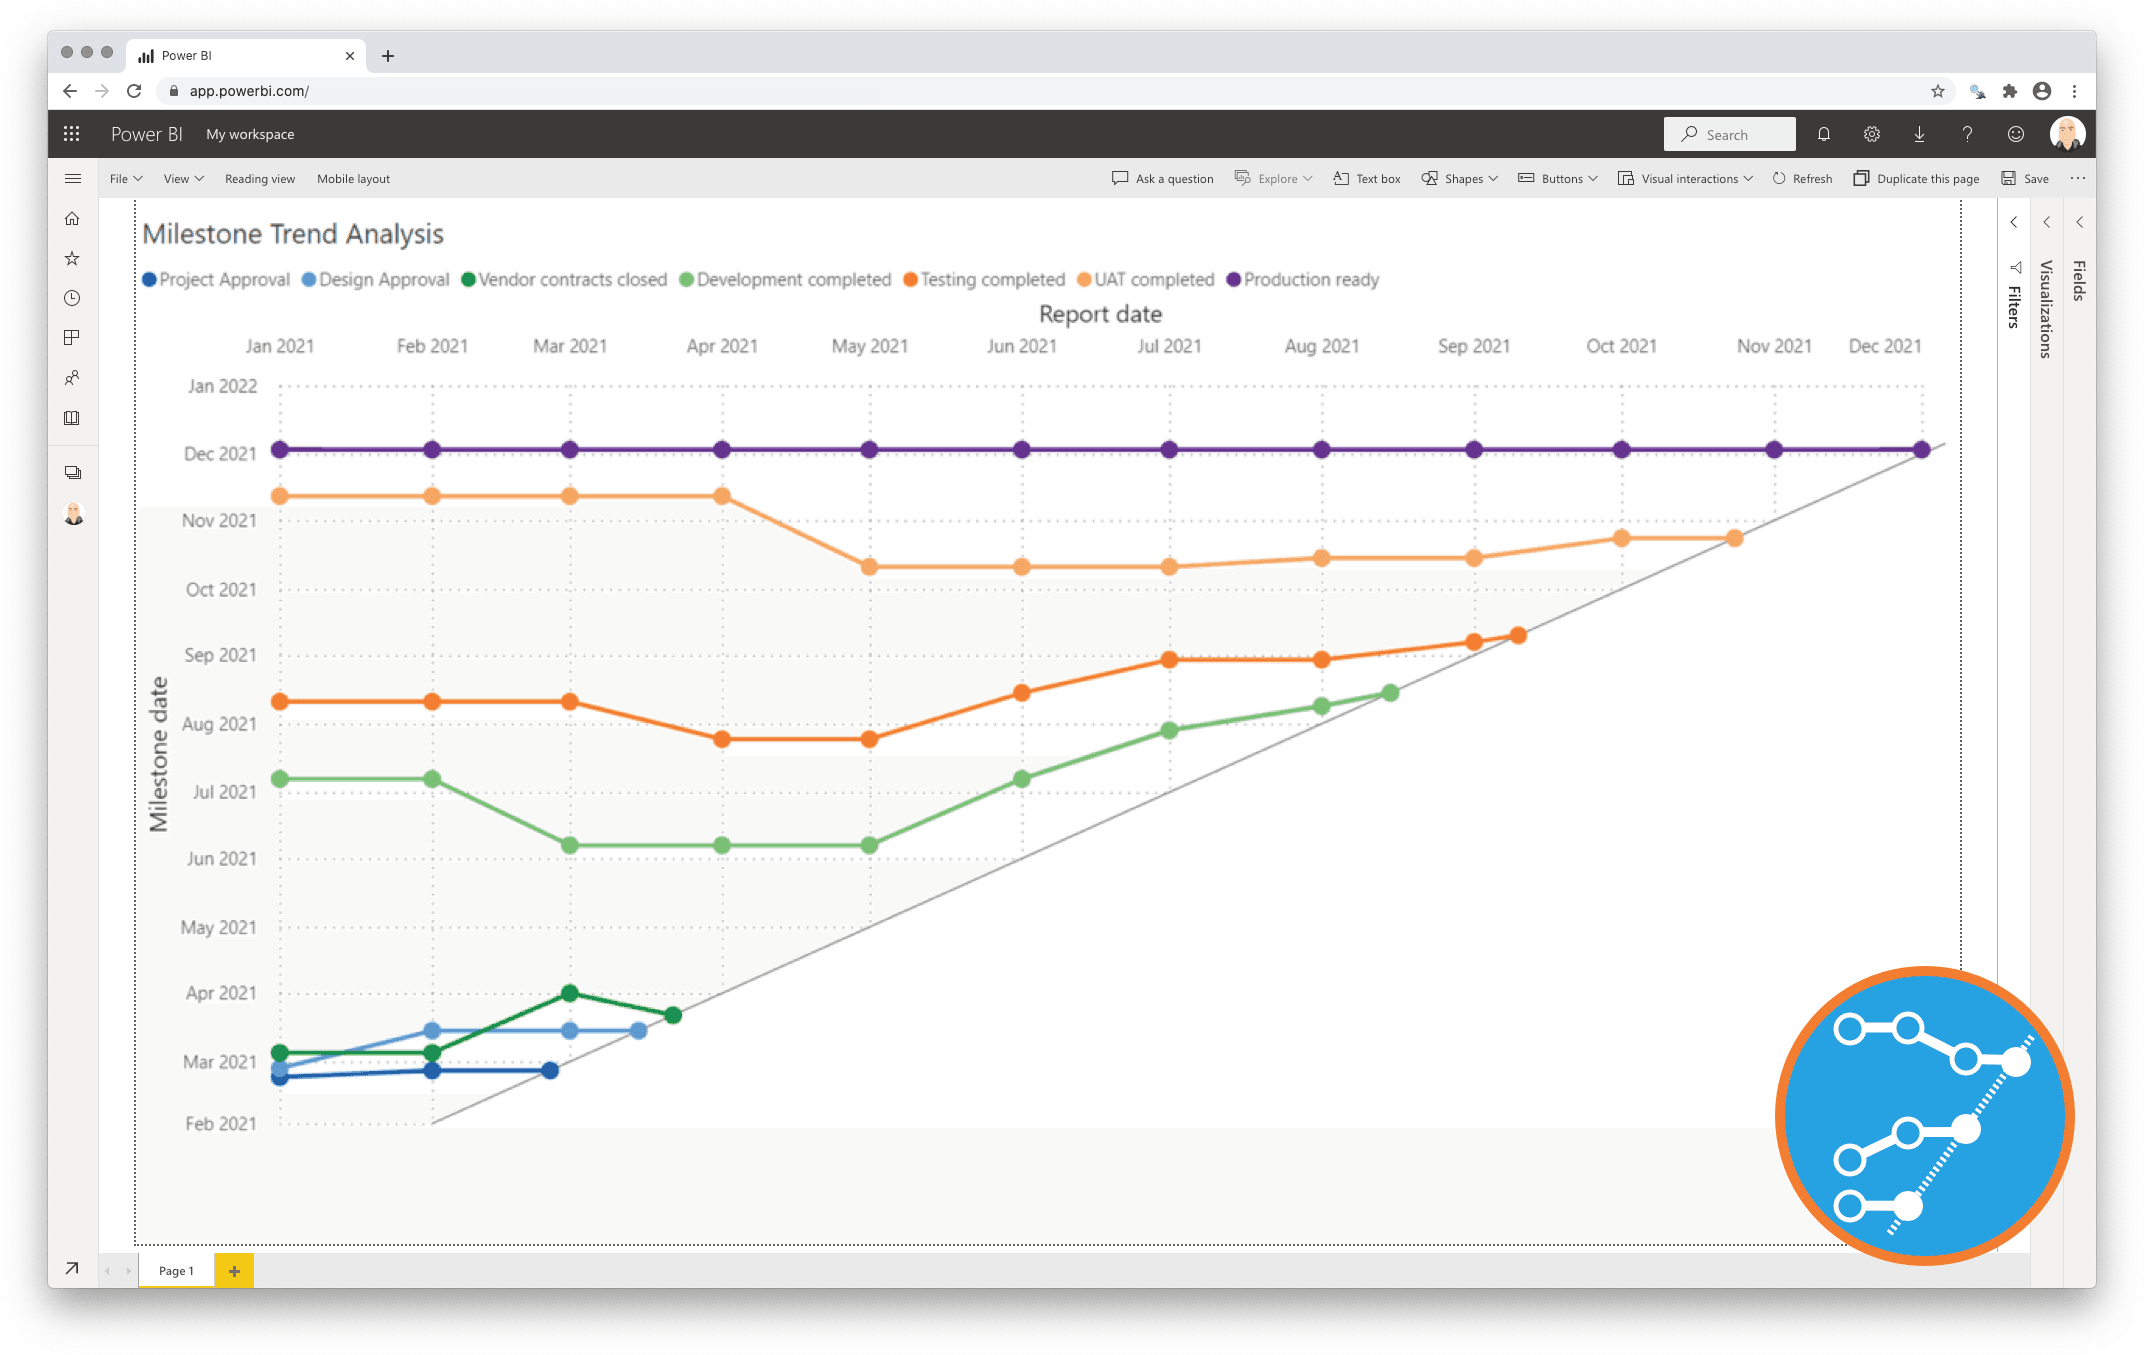
Milestone Trend Analysis Chart
Effective and clean supervision of your project progress
In every medium to large project there is a set of milestones. Milestones are critical moments during a project that are used to mark project progress. But we also know milestone dates can change: some are brought forward and some get delayed.
These changes in milestone dates are early warning signals of challenges in your project progress. The Milestone Trend Analysis Chart for Power BI gives every project manager a clear overview of these changes. It visualizes what is and is not working in the project. It also helps to signal issues with the project scope.
One year license within one Power BI Fabric F32 Capacity or smaller including support for unlimited number of users
€ 1.860
You will receive your license code by email after payment.