
← Continue shopping 
Power BI Visuals
Attribute Control Chart
Attribute Control Chart
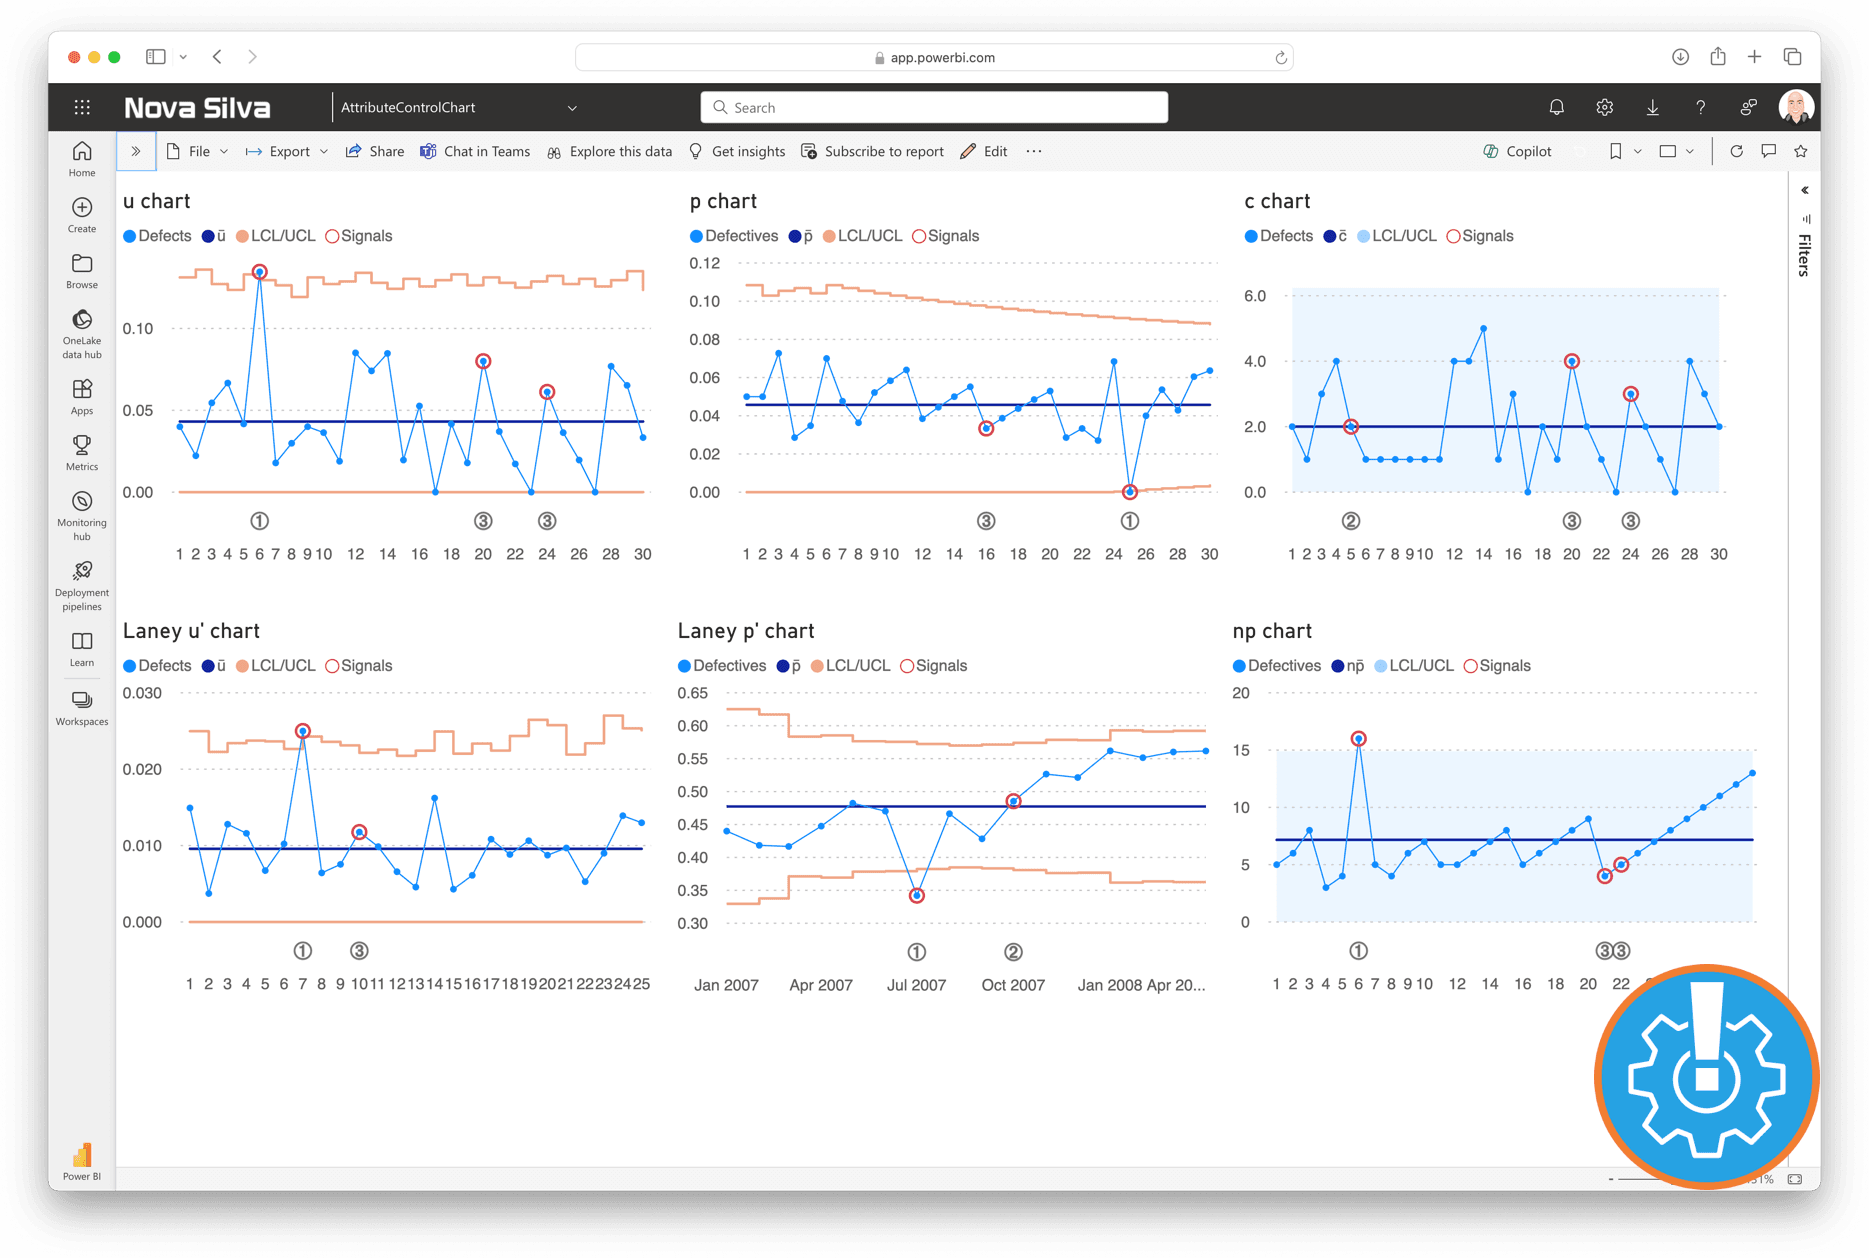
The Attribute Control Chart in Power BI offers a comprehensive view of process quality by allowing users to monitor defects/defectives and their corresponding metrics. This visual supports six types of Attribute Control Charts, including:
- c chart: Monitors the number of defects in each sample when the sample size is constant.
- u chart: Tracks the number of defects per unit when the sample size varies.
- Laney u’ chart: A modified version of the u chart to adjust for overdispersion or underdispersion in your data.
- p chart: Observes the proportion of defective items in each sample when the sample size varies.
- Laney p’ chart: A modified version of the p chart to adjust for overdispersion or underdispersion in your data.
- np chart: Displays the count of defective items in each sample when the sample size is constant.
One year license within one Power BI Fabric F32 Capacity or smaller including support for unlimited number of users
€ 2.820
You will receive your license code by email after payment.